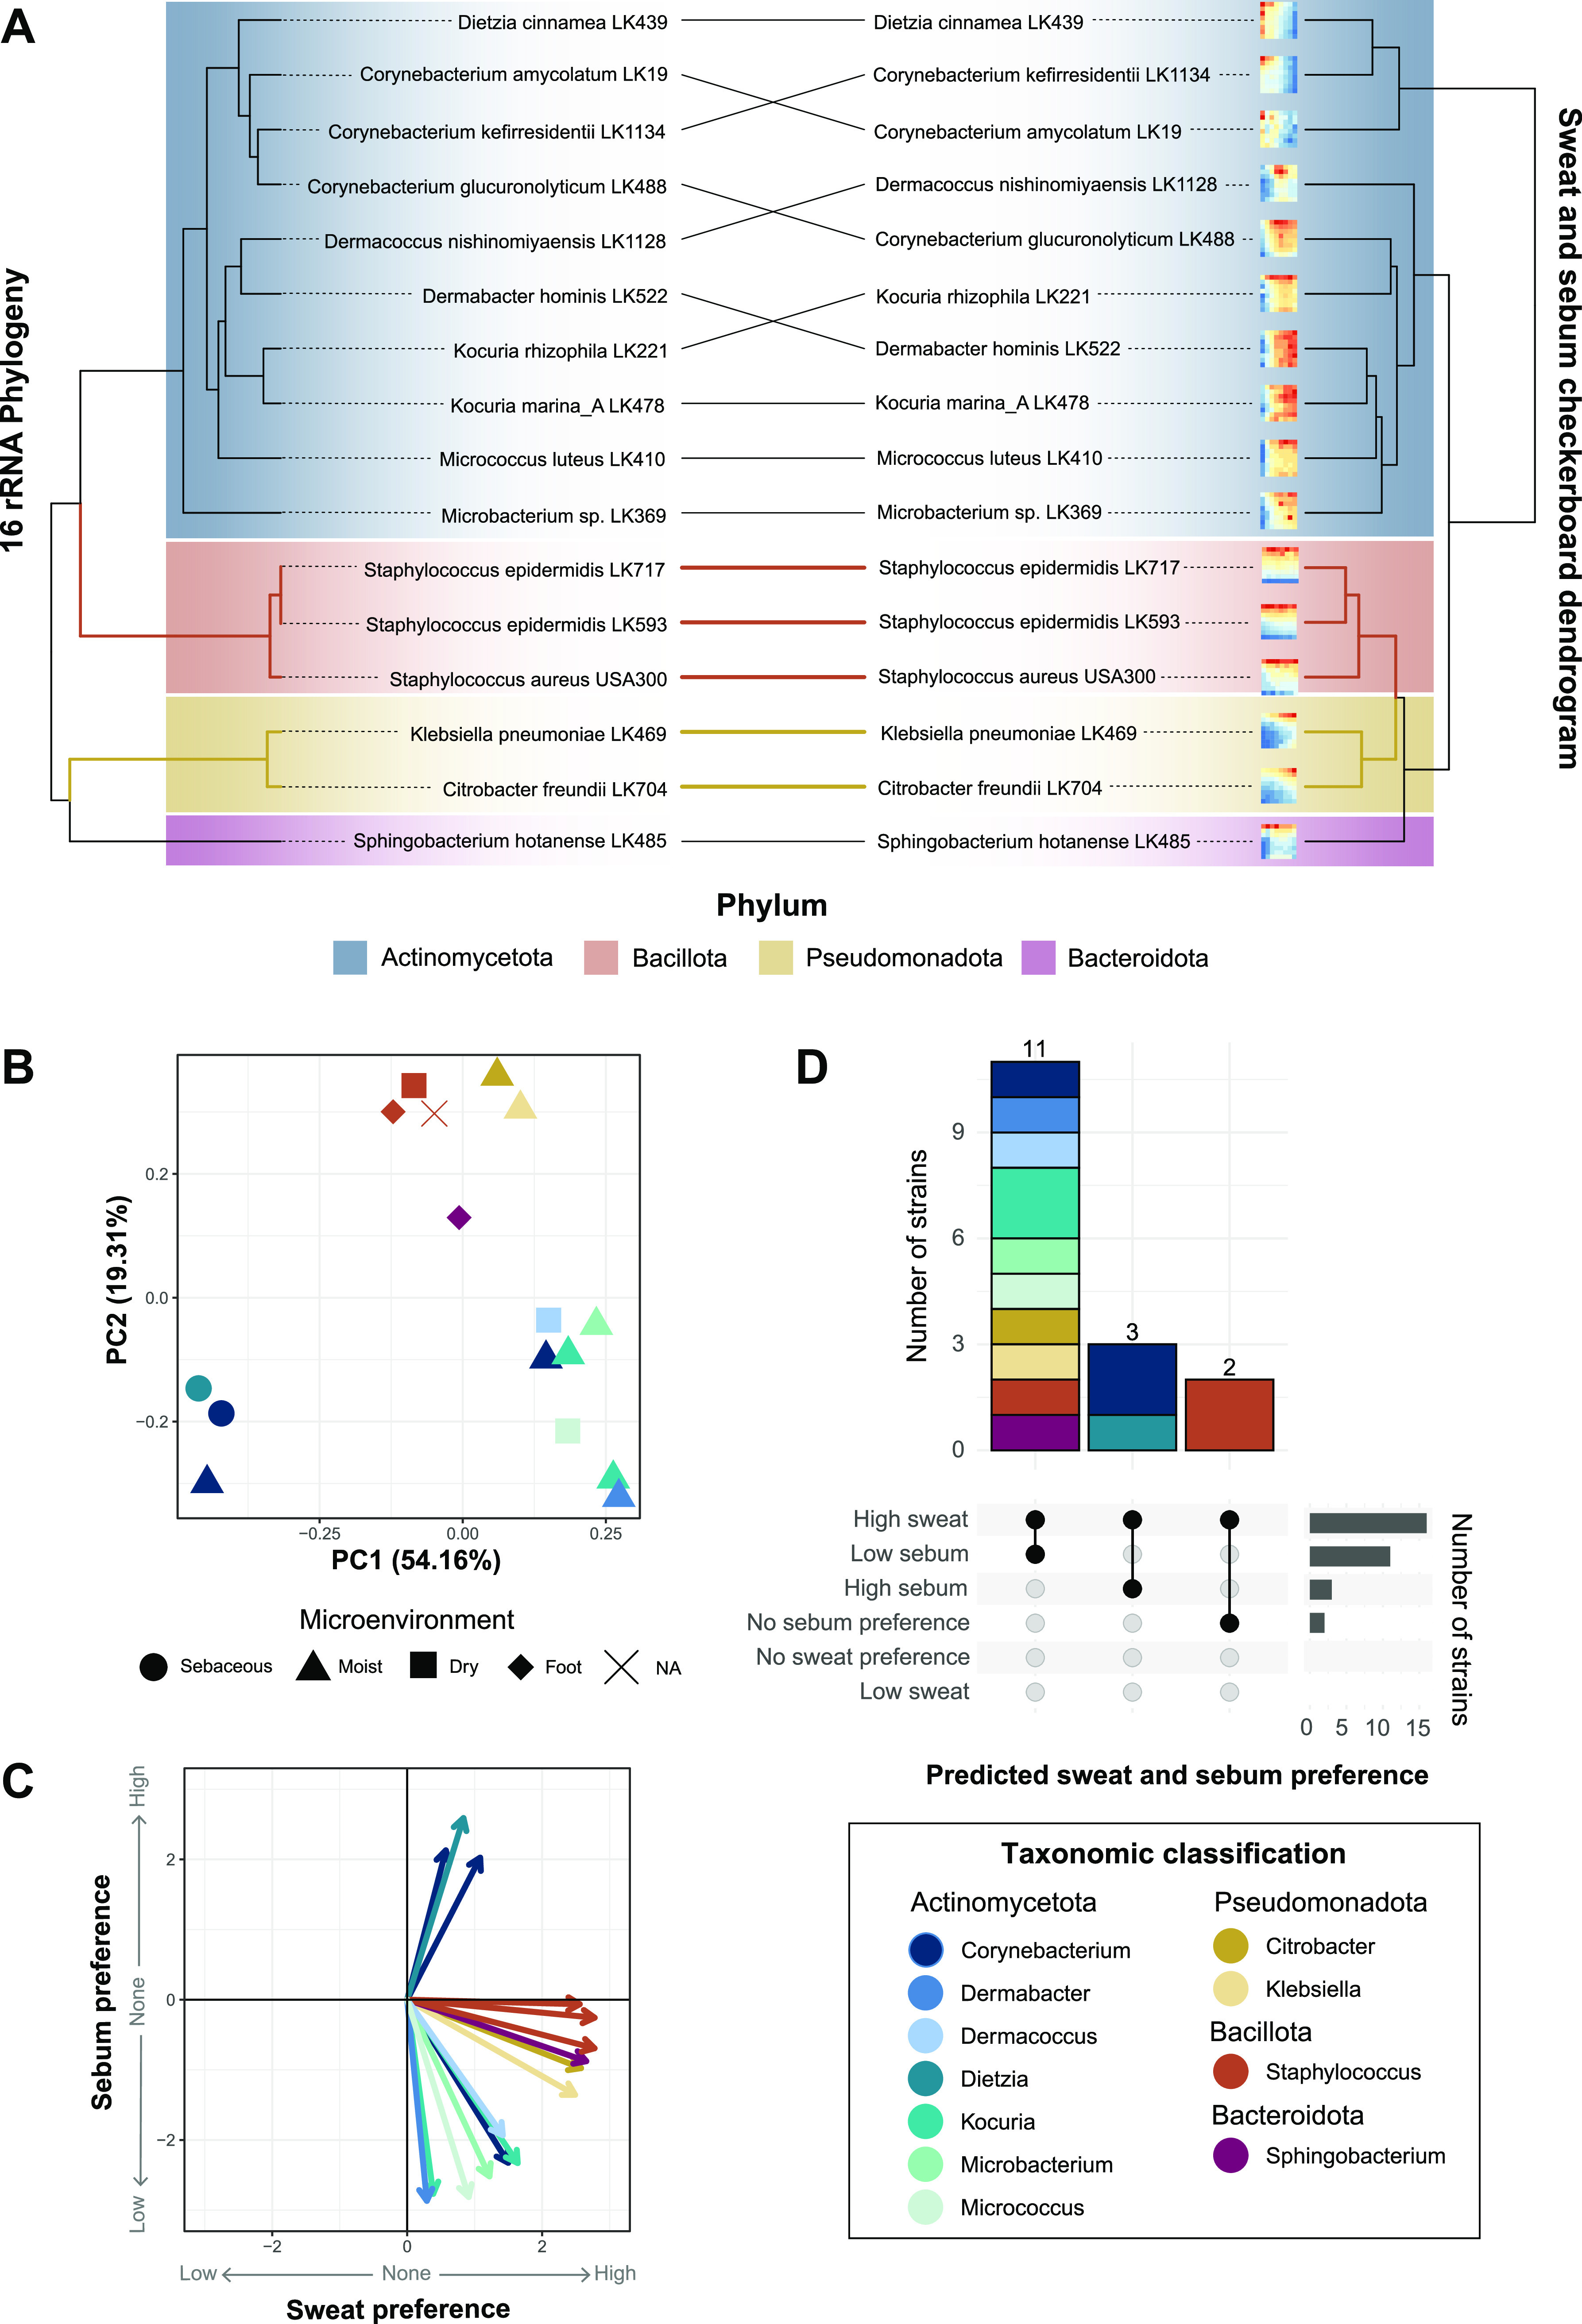
FIG 5.

Skin species groups by sweat and sebum preferences. (A) Hierarchical clustering was performed on z-score-normalized data from the sweat and sebum checkerboard assays. Results are plotted as a tanglegram with the resulting dendrogram (right) and the 16S rRNA phylogeny from Fig. 1A (left). (B and C) Principal-component analysis (B) and multiple linear regression analysis (C) were performed using the z-score-normalized data. In panel C, the slope coefficients for sweat concentrations and sebum concentrations from the regression analysis are plotted as x and y coordinates, respectively. NA, not applicable. (D) Strains are classified by sweat and sebum preferences based on the following slope coefficient (βSweat or βSebum) and P value cutoffs: low-sweat preference at a βSweat value of <0 and a P value of <0.05, high-sweat preference at a βSweat value of >0 and a P value of <0.05, no sweat preference at a P value of >0, low-sebum preference at a βSebum value of <0 and a P value of <0.05, high-sebum preference at a βSebum value of >0 and a P value of <0.05, and no sebum preference at a P value of >0. Strains are colored by phylum (A) or genus (B to D).
