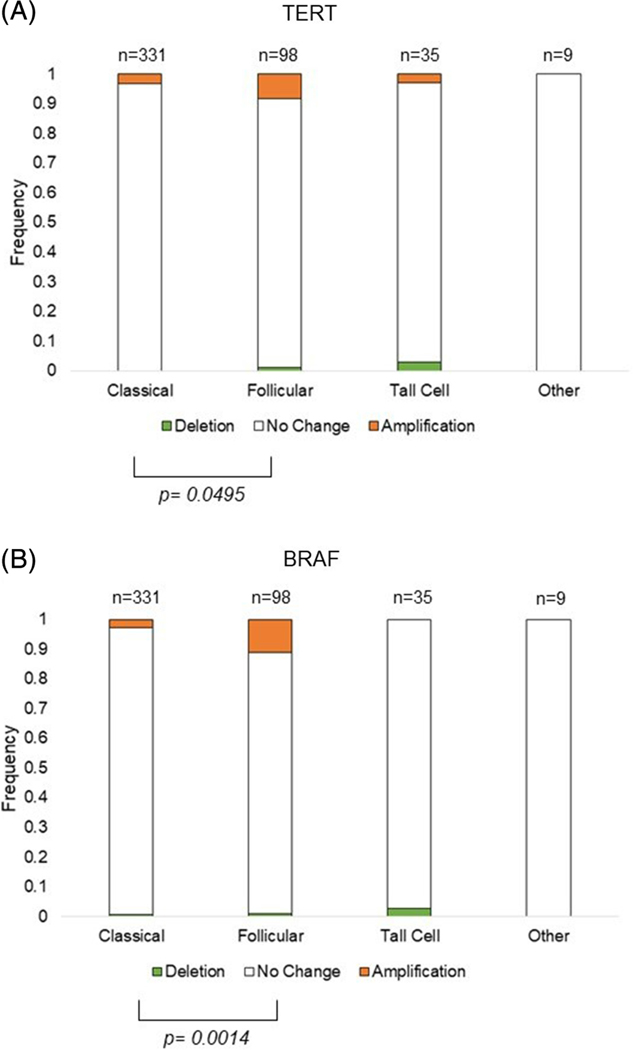
FIGURE 1.
Frequency of TERT and BRAF CNV by histological PTC subtype. CNV is represented by a deletion in green, no change in white, or amplification in orange, of A, TERT or B BRAF. The bars show the frequency of the CNV in each histological subtype, with the number of tumors shown above the bars and the frequency to the right of the bars. Significance of P ≤ .05 of the frequency between two histological subtypes is denoted by brackets. The histological subtype “other” includes: one columnar cell variant PTC, one encapsulated FVPTC, four diffuse sclerosing variant PTC, one mixed papillary and follicular variant PTC, and two cribriform morular PTC. PTC, papillary thyroid cancer

