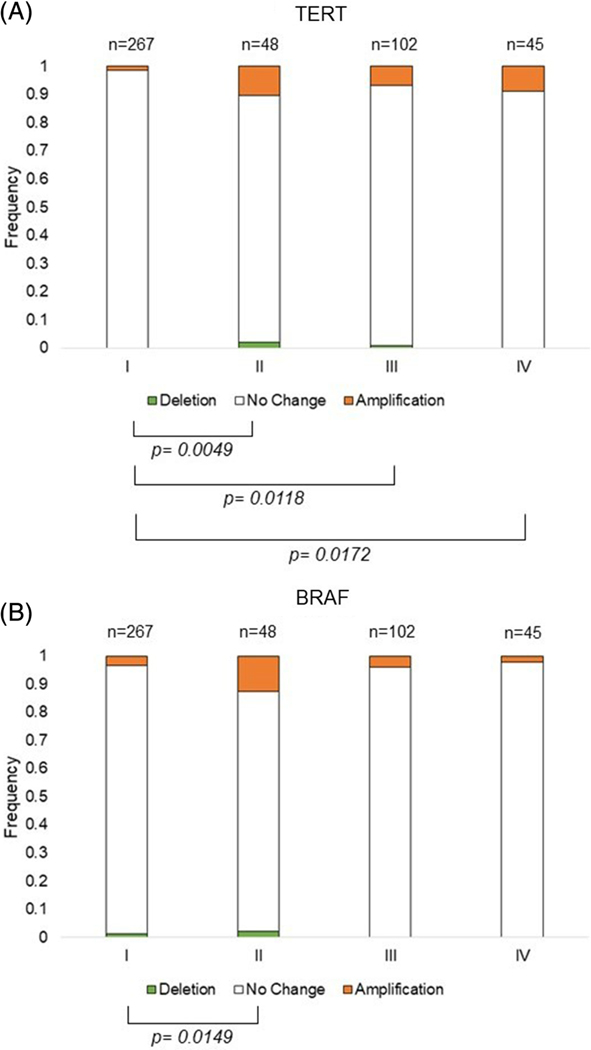
FIGURE 2.
Frequency of TERT and BRAF CNV by tumor stage. CNV is represented by a deletion in green, no change in white, or amplification in orange, of A, TERT or B, BRAF. The bars show the frequency of the CNV in each tumor stage (I-IV), with the number of tumors shown above the bars and the frequency to the right of the bars italicized. Significance of P ≤ .05 of the frequency between two stages is denoted by brackets. CNV, copy number variation

