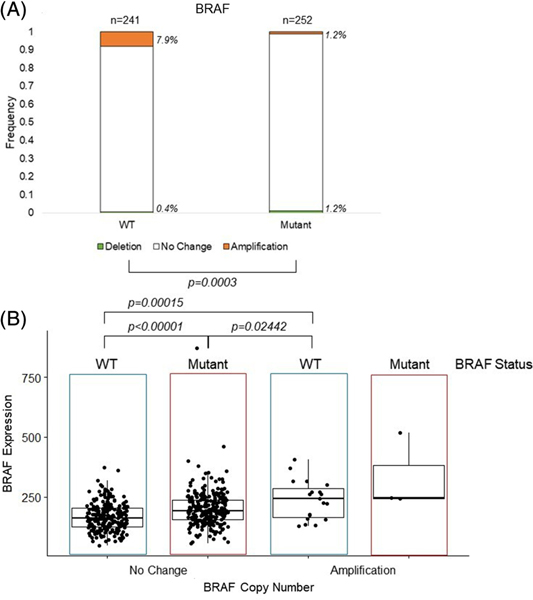
FIGURE 4.
Frequency of BRAF CNV by BRAF mutation status and resulting BRAF expression. A, BRAF CNV and BRAF mutation status. CNV is represented by a deletion in light grey, no change in white, or amplification in black, of BRAF. The bars show the frequency of the CNV in wildtype (WT) or BRAF mutant (Mutant) tumors, with the number of tumors shown above the bars and the frequency to the right of the bars italicized. Significance of P ≤ .05 of the frequency between two stages is denoted by brackets. B, Normalized RNA-sequencing read counts of BRAF expression by tumors with no change and amplification, stratified by BRAF mutation status, WT or Mutant. Dots represent individual tumor expression levels, with the median and interquartile range depicted. CNV, copy number variation

