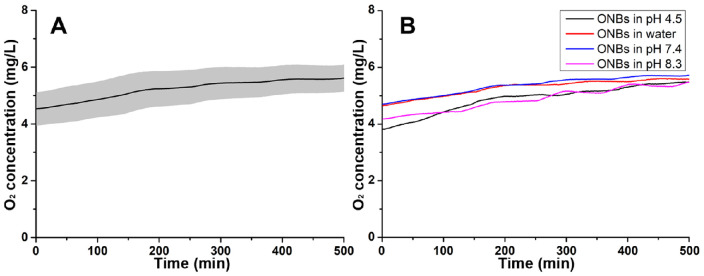
Figure 3.
Oxygen release profiles at varying pHs. (A) Change in oxygen concentration upon release in isolated hypoxic system. The black line represents the average oxygen concentration, and the grey area depicts the standard deviation from 3 replications. (B) Oxygen concentration change with respect to pH. The pH of the sample in water is 7.0.

