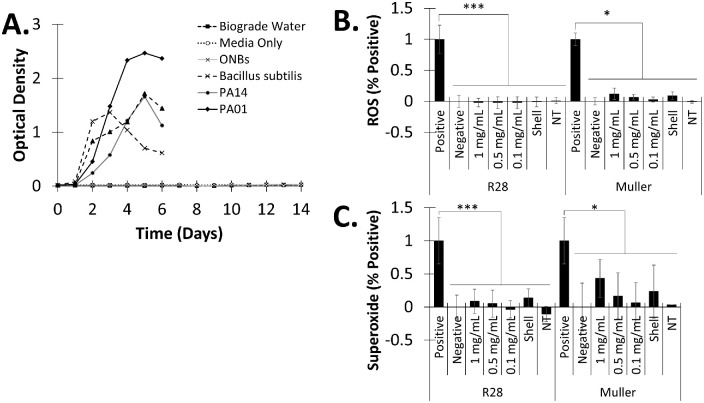
Figure 4.
Sterility and ROS evaluation in retinal cells. (A) Optical density of NBs in the soybean-casein digest media with bacteria over time (n = 5). (B) ROS generation after exposure to R28 and Muller cells with different concentration of ONBs (n = 8). (C) Superoxide levels in retinal cells after treatment (n = 8). NT, no treatment; Negative control, N-acetyl-L-cysteine; Positive control, pyocyanin. All data shown as mean ± standard deviation. ***P < 0.0001; *P < 0.05.

