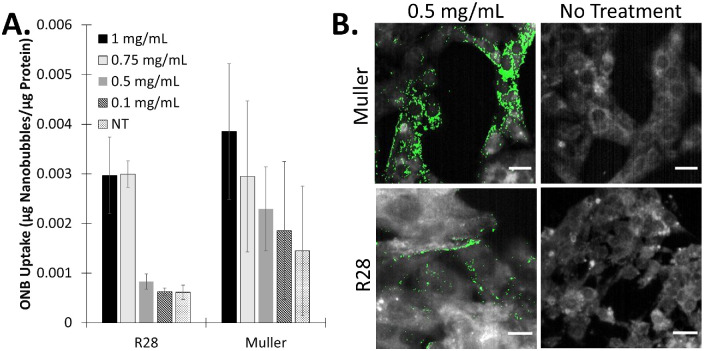
Figure 5.
Uptake of ONBs by retinal cells. (A) Quantitative representation of fluorescent acridine orange labeled ONBs (n = 4). NT, No treatment. All data are represented as the mean ± standard deviation. (B) Darkfield images of Muller cells and R28 cells. Cellular uptake of fluorescent NBs (green). Scale bar, 10 µm. Original magnification ×40.

