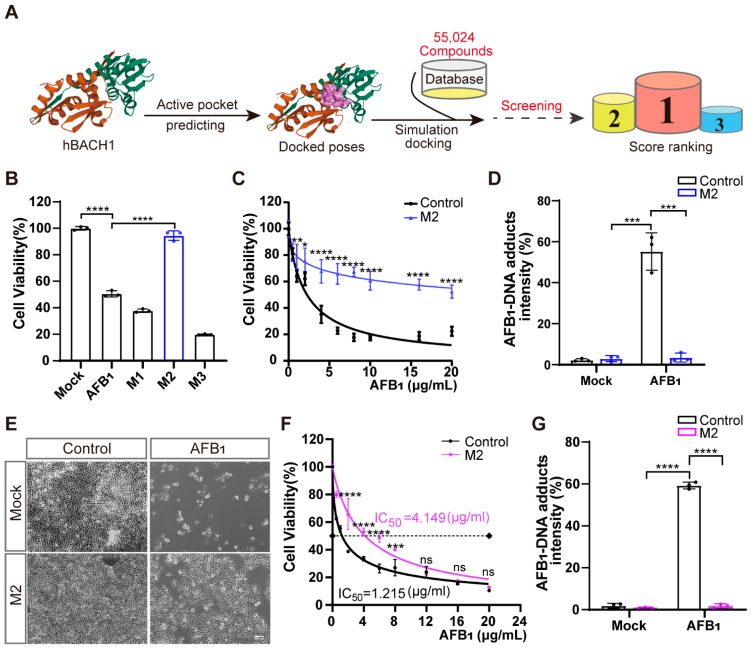
Figure 4.
Treatment with inhibitor M2 leads to the highest resistance to aflatoxin B1 in vitro. (A) Workflow of the structure-based virtual screening to identify inhibitors targeting BACH1. (B) Validation of the top three inhibitors (M1, M2, and M3) in Huh7 cells by CCK-8 assays. (C) Comparation of Huh7 tolerance to different AFB1 concentrations with and without M2 treatment. (D) The relative fluorescence intensity of AFB1-DNA adducts in Huh7 cells with and without M2 treatment. (E) Representative light microscopy images of AFB1-treated PK-15 cells with or without M2 treatment. Scale bar, 100 μm. (F) The IC50 assays for AFB1 in PK-15 cells with and without M2 treatment determined with CCK-8 assays. (G) The relative fluorescence intensity of AFB1-DNA adducts in PK-15 cells with and without M2 treatment. * p < 0.05, ** p < 0.01, *** p < 0.001, **** p < 0.0001, ns, not significant. p values were determined with two-tailed Student’s t-tests. AFB1, aflatoxin B1; M1, 1-Piperazineethanol, 4-phenyl-α-[[(3,4,5-trimethoxyphenyl)methoxy]methyl]; M2, 1-Piperazineethanol,α-[(1,3-benzodioxol-5-yloxy)methyl]-4-(2-methoxyphenyl); M3, 1,2-Ethanediamine, N1, N1, N2, N2-tetrakis (1H-benzimidazol-2-ylmethyl).

