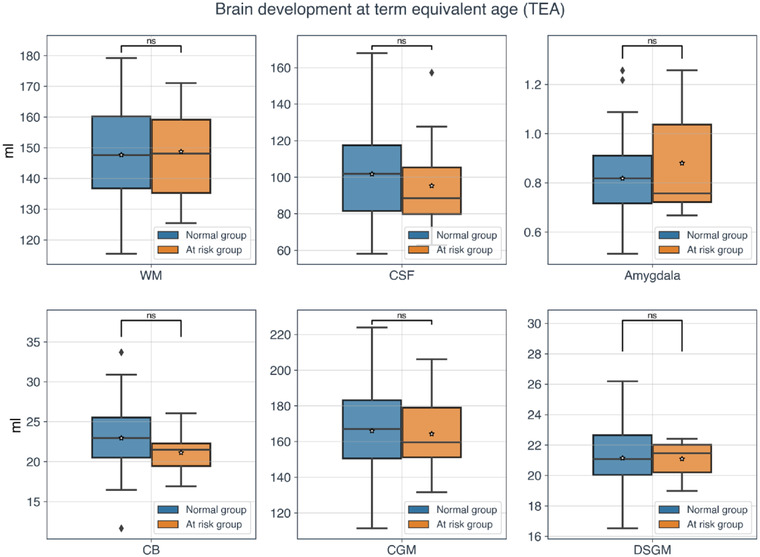
FIGURE 1.

Brain absolute volumes at term‐equivalent‐age (TEA). Boxplots for white matter (WM), cerebrospinal fluid (CSF), amygdala, cerebellum (CB), cortical gray matter (CGM), and deep subcortical gray matter (DSGM) of the two groups of participants based on the strengths and difficulties questionnaire (SDQ) total difficulties score variable. Blue and orange colors represent the normal and at‐risk group, respectively. No statistically significant differences between the volumetric data of the two groups were observed. The asterisk represents the mean value, whereas the black line inside the boxplots depicts the median.
