
FIGURE 3.
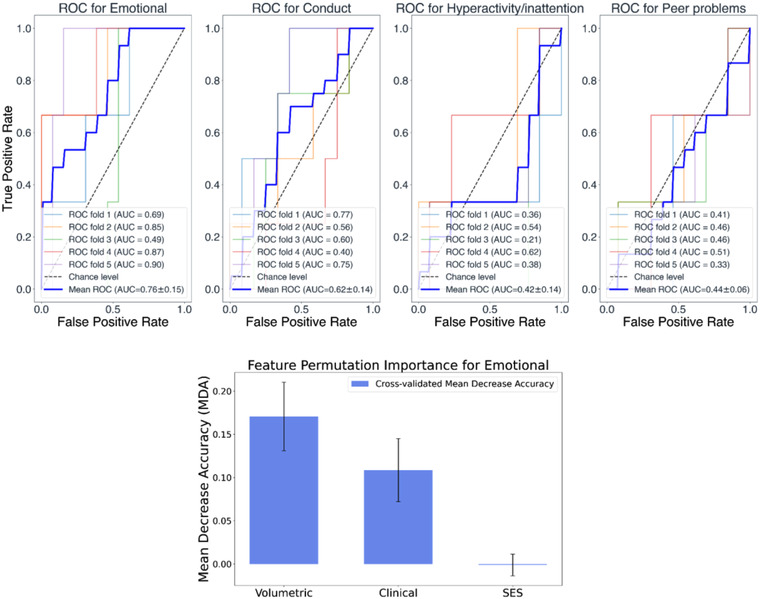
Top panel: Classification receiver operating characteristic (ROC) curves using all three sets of variables (volumetric, perinatal, and social economic score [SES]) and, as target variables, the four strengths and difficulties questionnaire (SDQ) subscales (i.e., emotional, conduct, hyperactivity/inattention, and peer problems). Bottom panel: Mean decrease accuracy (MDA) values of the individual sets of variables. Bar height represents the average across permutations MDA value for the specific set of variables, and the error bars show the standard deviation of these MDA values.