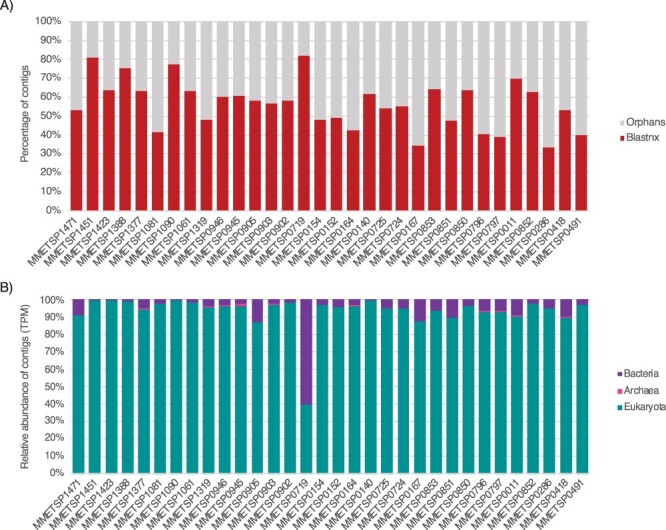
Figure 3.

Taxonomic assignment of contigs in RNA virus-positive MMETSP libraries. (A) Ratio of contigs with hits to the nt and nr databases (red) versus orphans contigs (grey). (B) Relative abundance of cellular organism-like contigs based on the taxonomic assignment of their closest homologs in the nr and nt databases at the kingdom level. Contig abundances are calculated as transcripts per million (TPM).
