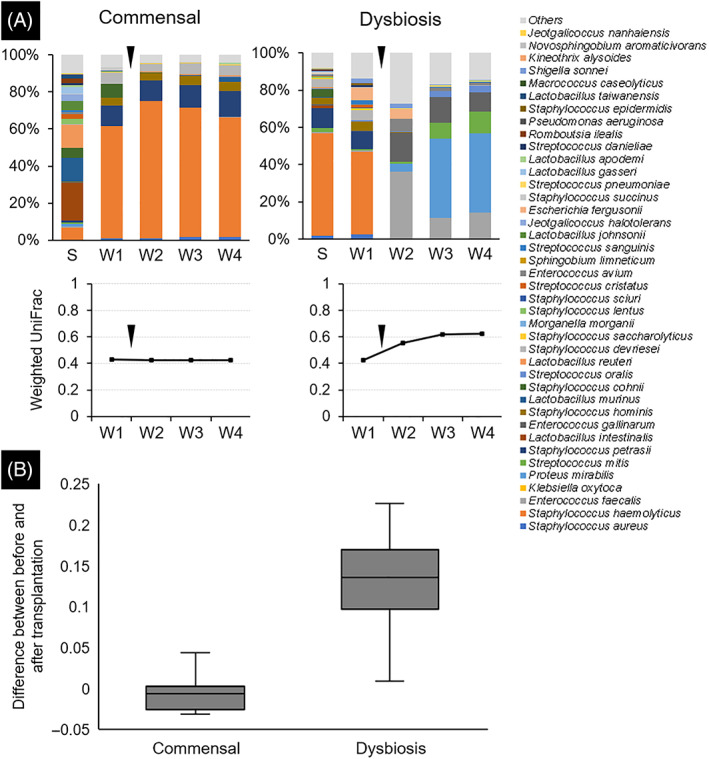
FIGURE 3.

Composition and diversity of the microbiota. Swab samples collected from skin and wounds were used for the 16S rRNA gene analysis to identify the microbiota. (A) One case from each of the commensal and dysbiosis groups was presented. The bar graph shows the composition of the microbiota at each site. The line graph shows the temporal change of microbial similarity between the skin sample collected on post‐wounding day 1 and the wound sample at each time point. Black triangles indicated the time point of microbiota transplantation. (B) The difference in the values of the weighted UniFrac dissimilarity index between the post‐wounding day 1 and 2 values (before and after microbiota transplantation) was calculated. S, skin samples collected on PWD1; W, wound samples
