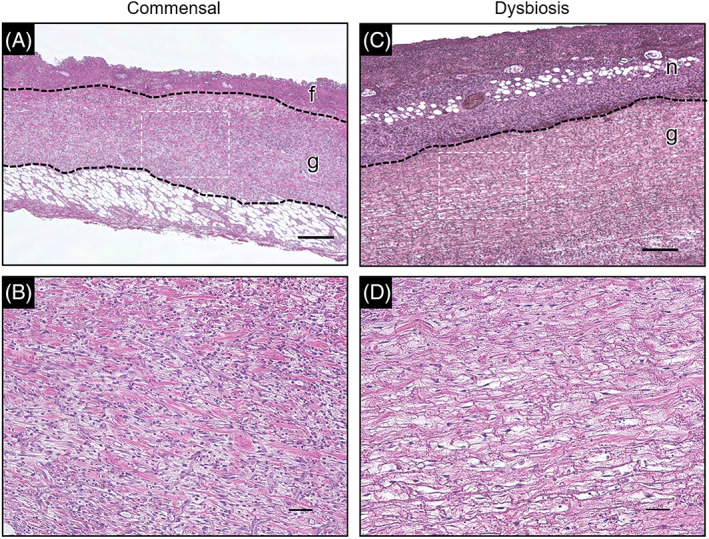
FIGURE 5.

Haematoxylin and eosin staining of the wound tissue. Pathophysiological analysis was performed using haematoxylin and eosin staining of paraffin sections prepared from post‐wounding day 4 wound tissue. (A,C) Lower magnification images of the commensal and dysbiosis groups. Regions enclosed in the dotted line are at higher magnification (B,D). (f,g,n) The fibrin membrane, granulation tissue, and necrotic tissue, respectively. Magnification: ×4.0. Scale bar = 300 μm. (B,D) Higher magnification images of the granulation tissue. Magnification: ×20. Scale bar = 50 μm
