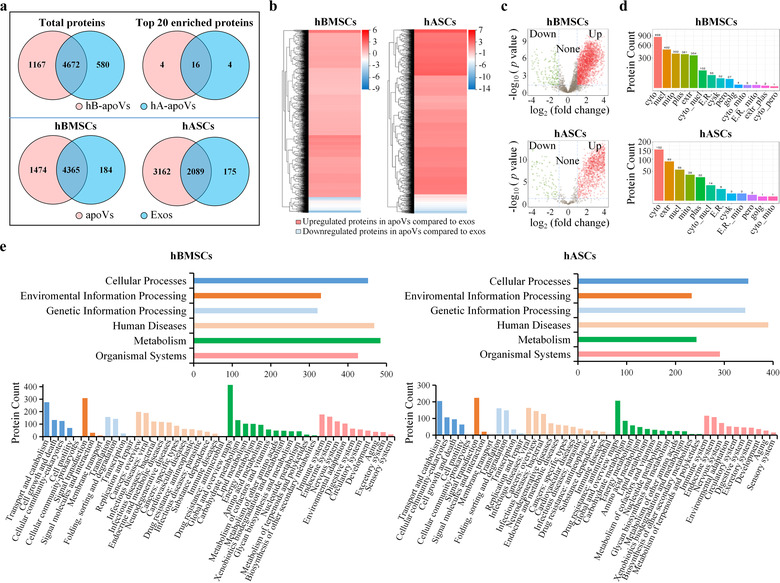
FIGURE 2.

Comparison of proteomic profile between apoVs and exosomes from MSCs. (a) Venn diagram representing the numbers of unique and overlapping proteins between two groups. Upper panel showing detected proteins in apoVs from hBMSCs and hASCs. Lower panel showing detected proteins in apoVs and exosomes from hBMSCs or hASCs. hB‐apoVs, apoVs derived from hBMSCs; hA‐apoVs, apoVs derived from hASCs; Exos, exosomes. (b) Clustering heatmap of differentially expressed proteins (DEPs) in apoVs compared to exosomes. The horizontal axis represents the differential measure log2 (fold change), and the vertical axis represents proteins. Enrichment is depicted in red and depletion in blue. (c) Volcano plots showing significantly upregulated (red dots) and downregulated (green dots) proteins in apoVs compared to exosomes. Fold change > = 2 and adjusted p‐value < 0.05 were used to obtain DEPs. (d) Subcellular localizations of DEPs in apoVs compared to exosomes. Cyto, cytosol; Nucl, nucleus; Mito, mitochondria; Plas, plasma membrane; Extr, extracellular; Cyto_nucl, cytosol‐nucleus; E.R., endoplasmic reticulum; Cysk, cytoskeleton; Pero, peroxisome; Golg, golgi apparatus; Cyto_mito, cytosol‐mitochondria; E.R._mito, endoplasmic reticulum‐mitochondria; Extr_plas, extracellular‐plasma membrane; Cyto_pero, cytosol‐peroxisome. (e) Kyoto Encyclopedia of Genes and Genomes (KEGG) pathway analysis of significantly upregulated proteins in apoVs compared to exosomes from hBMSCs and hASCs. Upper panel is KEGG level 1, and lower panel is KEGG level 2. hBMSCs, human bone marrow MSCs; hASCs, human adipose MSCs
