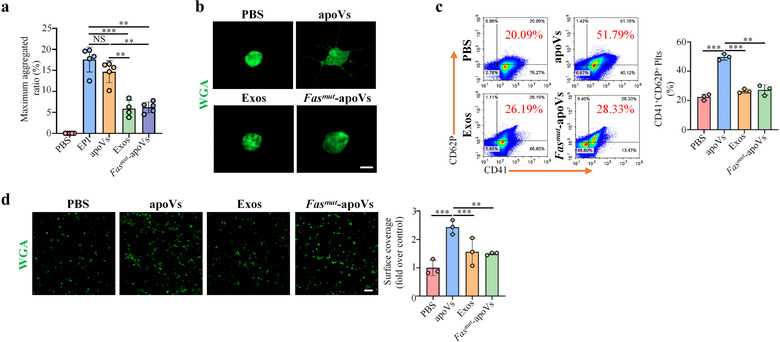
FIGURE 7.

ApoVs activate platelet functions of haemophilia A (HA) mice in vitro. (a) Aggregation analysis showing the aggregation of platelets when treated with apoVs, exosomes, or Fasmut ‐apoVs. The maximal aggregation ratio (MAR) was calculated. PBS was used as negative control, whereas EPI was used as positive control. Notably, values of MAR lower than the detection range of the analyzer were recorded as “0.” EPI, epinephrine. N = 4–5 per group. (b) Representative confocal microscopy images showing the morphological change of platelets. The platelets were incubated with apoVs, exosomes, or Fasmut ‐apoVs, and subsequently stained with WGA (green). Scale bar, 2 μm. (c) Flow cytometric analysis and the corresponding quantification of the percentages of CD41+ and CD62P+ platelets. The platelets were incubated with apoVs, exosomes, or Fasmut ‐apoVs, and subsequently stained with CD41 and CD62P. N = 3 per group. (d) Representative platelet spreading and the corresponding quantification of fold changes relative to negative control group. After incubation with apoVs, exosomes, or Fasmut ‐apoVs at 37°C for 30 min, platelets were placed on fibrinogen‐coated glass coverslips at 37°C for 90 min followed by staining with WGA (green). Scale bar, 10 μm. N = 3 per group. apoVs, apoVs derived from WT mBMSCs; Exos, exosomes derived from WT mBMSCs; Fasmut ‐apoVs, apoVs derived from Fasmut mBMSCs. Data were presented as mean ± standard deviation (SD). Statistical analyses were performed by one‐way ANOVA with Tamhane's T2 post hoc test for multiple group comparisons. NS, not significant; **p < 0.01; ***p < 0.001
