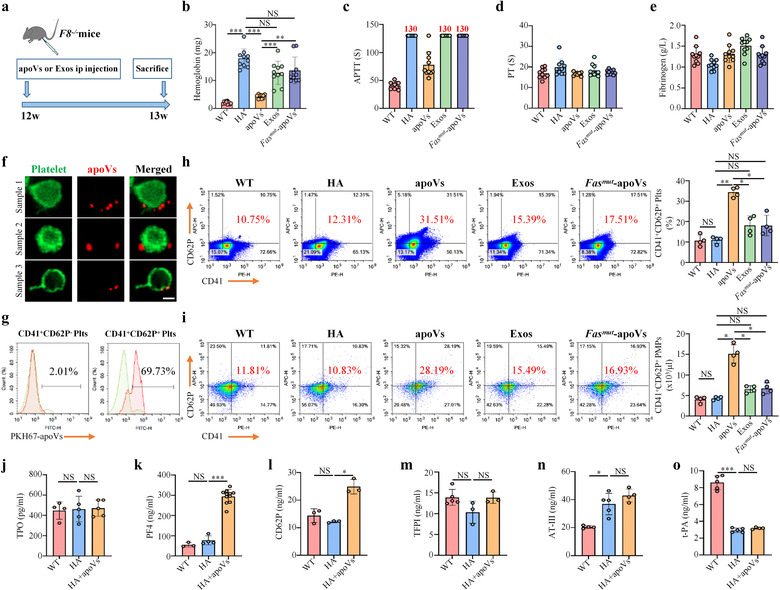
FIGURE 9.

ApoV infusion ameliorates hemostasis of haemophilia A (HA) mice via upregulating platelet activity. (a) Schematic diagram indicating the study design of apoV‐mediated treatment for HA mice. (b) Tail bleeding model in HA mice and the corresponding haemoglobin assay. HA mice were injected intraperitoneally with PBS, apoVs, exosomes, or Fasmut ‐apoVs. At 7 days after injection, the distal tail of mice was transected at 5 mm and immersed into 4 ml isotonic saline at 37°C for 10 min under anaesthesia. The bleeding volume was quantified using a Hemoglobin assay kit. C57BL/6J mice were used as WT control. N = 10 per group. (c‐e) Coagulation analyses of murine blood plasma. HA mice were injected intraperitoneally with PBS, apoVs, exosomes, or Fasmut ‐apoVs. At 7 days after injection, coagulation analyses were performed by Stago EMO Express system. Notably, values of APTT larger than the detection range of the analyzer were recorded as “130 seconds”. APTT, activated partial thromboplastin time; PT, prothrombin time. N = 10 per group. (f) Representative confocal microscopy images showing binding of apoVs (red) to the surface of platelets (green) in vivo. After infusion of PKH26‐labeled apoVs for 1 h, platelets were isolated and stained with Alexa Fluor 488‐conjugated WGA. Scale bar, 1 μm. (g) Flow cytometric analysis showing binding of PKH67‐labeled apoVs to the surface of platelets in vivo. After infusion of PKH67‐labeled apoVs for 1 h, platelets were isolated and stained with CD41 and CD62P. (h) Flow cytometric analysis and the corresponding quantification showing the percentage of CD41+ and CD62P+ platelets. HA mice were injected intraperitoneally with PBS, apoVs, exosomes, or Fasmut ‐apoVs. At 7 days after injection, platelets were isolated and stained with CD41 and CD62P. N = 4 per group. (i) Flow cytometric analysis and the corresponding quantification showing the number of activated platelet‐derived microparticles (PMPs). HA mice were injected intraperitoneally with PBS, apoVs, exosomes, or Fasmut ‐apoVs. At 7 days after injection, PMPs were isolated and stained with CD41 and CD62P. C57BL/6J mice were used as WT control. BD liquid counting beads were used to quantify the number of PMPs. N = 4 per group. (j‐o) ELISA analysis of TPO (j), PF4 (k), CD62P (l), TFPI (m), AT‐III (n), and t‐PA (o) in blood plasma of WT, HA, or HA mice injected with apoVs for 7 days. TPO, thrombopoietin; PF4, platelet factor 4; TFPI, tissue factor pathway inhibitor; AT‐III, antithrombin; t‐PA, tissue‐type plasminogen activator. N = 3–11 per group. apoVs, apoVs derived from WT mBMSCs; Exos, exosomes derived from WT mBMSCs; Fasmut ‐apoVs, apoVs derived from Fasmut mBMSCs. Data are presented as mean ± standard deviation (SD). Statistical analyses were performed by one‐way ANOVA with Tukey's post hoc test or Welch's ANOVA with Tamhane's T2 post hoc test for multiple group comparisons. NS, not significant; *p < 0.05; **p < 0.01; ***p < 0.001
