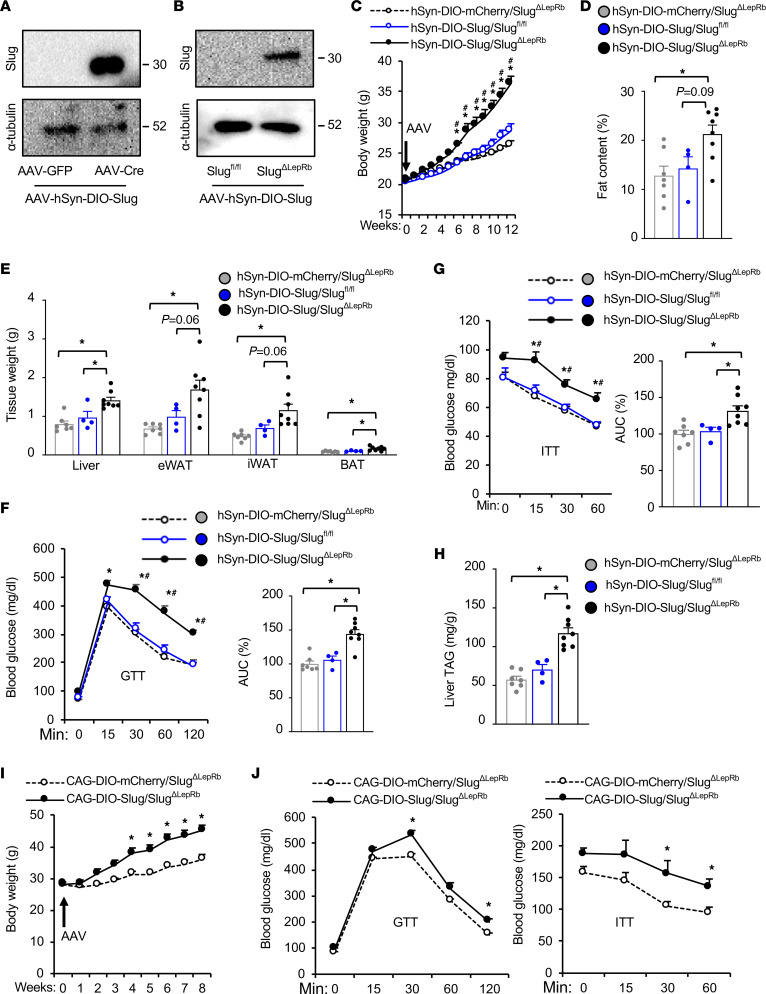
Figure 6. Hypothalamic LepRb neuron–specific overexpression of Slug induces obesity.
(A) AAV-hSyn-DIO-Slug vectors were coinjected with either AAV-CAG-GFP or AAV-CAG-Cre vectors into the brains of C57BL/6J mice. Brain extracts were prepared 3 weeks later and immunoblotted with antibodies against Slug or α-tubulin. (B–H) AAV-hSyn-DIO-Slug or AAV-hSyn-DIO-mCherry vectors were bilaterally microinjected into the MBH of SlugΔLepRb (Slugfl/fl;LepRb-Cre+/+) males (8 weeks, on chow diet). Slugfl/fl males (lacking Cre) were injected with AAV-hSyn-DIO-Slug vectors (control). (B) Hypothalamic extracts were immunoblotted with antibodies against Slug or α-tubulin (12 weeks after AAV transduction). (C) Body weight. (D) Fat content at 12 weeks after AAV transduction (% body weight). (E) Tissue weight (12 weeks after AAV transduction). (F and G) GTT and ITT at 11 weeks after AAV transduction. (H) Liver TAG levels at 12 weeks after AAV transduction (normalized to liver weight). AAV-hSyn-DIO-Slug/ SlugΔLepRb, n = 8; AAV-hSyn-DIO-mCherry/SlugΔLepRb, n = 7; AAV-hSyn-DIO-Slug/Slugfl/fl, n = 4. (I and J) AAV-CAG-DIO-Slug or AAV-CAG-DIO-mCherry vectors were bilaterally microinjected into the MBH of SlugΔLepRb (Slugfl/fl;LepRb-Cre+/–) male mice at 9 weeks of age on chow diet (n = 5 mice per group). (I) Body weight. (J) GTT (2 g glucose/kg) and ITT (1 unit insulin/kg) at 8 weeks after AAV transduction. Data are presented as mean ± SEM. *P < 0.05, 1-way (D and E, F [right panel], G [right panel], and H) and 2-way (C, F [left panel], G [left panel], I, and J) ANOVA.

