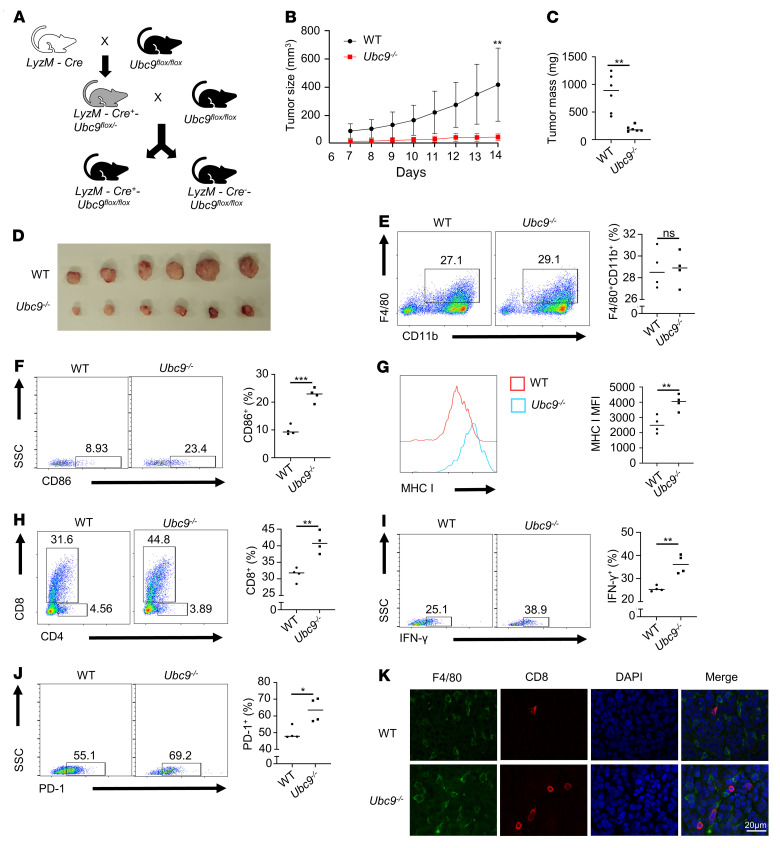
Figure 3. Ubc9 deficiency in macrophages suppresses the progression of PCa.
(A) Ubc9fl/fl mice were crossed with LyzM-Cre transgenic mice to generate the macrophage-specific Ubc9-knockout mice, which were denoted as LyzM-Cre+Ubc9fl/fl. (B–D) Tumor growth curve (B) and tumor mass (C and D) at day 14 in WT and Ubc9–/– groups (n = 7 per group). (E) Proportion of TAMs among CD45+ immune cells from WT and Ubc9–/– groups (n = 4 per group). (F) Proportion of CD86+ TAMs in WT and Ubc9–/– groups (n = 4 per group). (G) MHC I expression level on TAMs in WT and Ubc9–/– groups (n = 4 per group). (H) Proportion of tumor-infiltrating CD8+ T cells among CD45+ immune cells in WT and Ubc9–/– groups (n = 4 per group). (I and J) Proportion of IFN-γ+ (I) and PD-1+ (J) tumor-infiltrating CD8+ T cells in WT and Ubc9–/– groups (n = 4 per group). (K) Tumors from WT and Ubc9–/– mice were isolated, fixed, embedded in paraffin, sectioned, and stained for F4/80 (green) and CD8 (red). Similar results were obtained from 3 independent experiments. B was determined by log-rank test. Data in C and E–J represent mean ± SEM and were analyzed by Student’s t test. Scale bar: 20 μm. *P < 0.05; **P < 0.01; ***P < 0.001.

