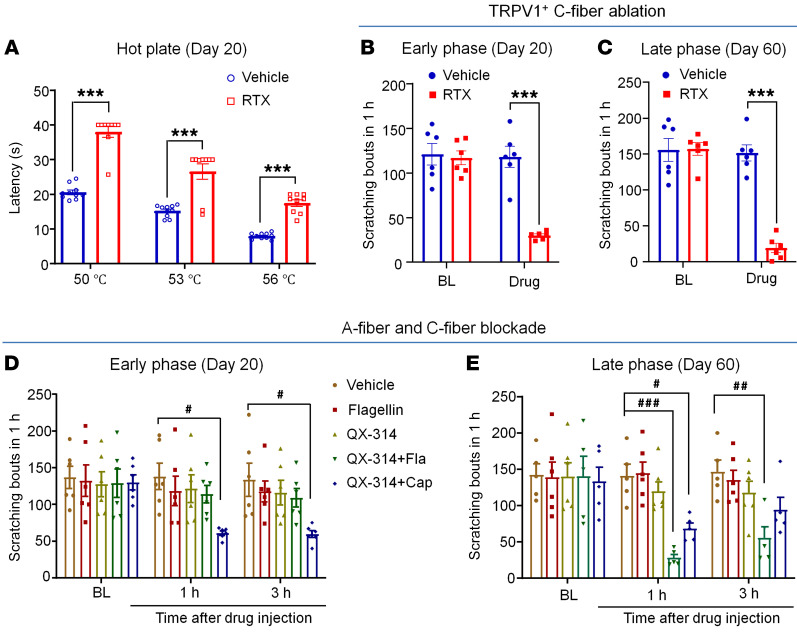
Figure 5. Effects of C-fiber or A-fiber nerve blockade on CTCL-induced pruritus in the early and late phases.
(A) Response latency in hot-plate tests at 50°C, 53°C, and 56°C in vehicle-treated (n = 10) and RTX-treated (n = 9) CTCL mice at day 20. F(2, 51) = 98.25, P < 0.0001. (B) CTCL-induced itch in the early phase (day 20) in mice before (baseline [BL])and after the treatment with vehicle (n = 6) or RTX (n = 6). F(1, 10) = 42.93, P < 0.0001. (C) CTCL-induced itch in mice in the late phase (day 60) before and after the treatment with vehicle (n = 6) or RTX (n = 6). F(1, 10) = 52.77, P < 0.0001. (D) CTCL-induced itch in the early phase (day 20) in mice before and 1 hour and 3 hours after the treatment with intratumoral injection of vehicle, flagellin (Fla) (1 μg, 30 μL), QX-314 (6 mM, 30 μL), QX-314 (6 mM, 30 μL) plus flagellin (1 μg), or QX-314 (6 mM, 30 μL) plus capsaicin (Cap) (10 μg). n = 6/group. F(4, 75) = 4.49, P = 0.0026. (E) CTCL-induced itch in the late phase (day 60) in mice before and 1 hour and 3 hours after intratumoral injection of vehicle, flagellin (1 μg, 30 μL), QX-314 (6 mM, 30 μL), QX-314 (6 mM, 30 μL) plus flagellin (1 μg), or QX-314 (6 mM, 30 μL) plus capsaicin (10 μg). n = 6/group. F(4, 22) = 4.20, P = 0.0112. Data are expressed as the mean ± SEM. Two-way ANOVA with Bonferroni’s post hoc test, #P < 0.05, ##P < 0.01, ###P < 0.001, and ***P < 0.001.

