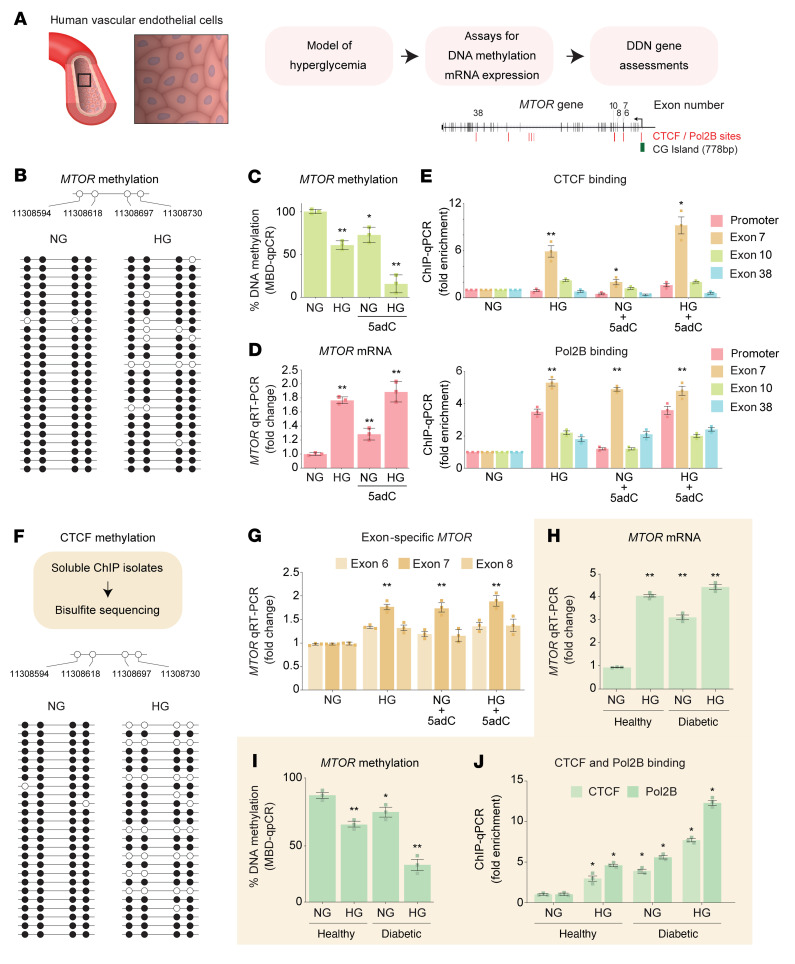
Figure 10. Methylation-mediated gene expression in human vascular endothelial cells.
(A) Model of hyperglycemia using primary human vascular endothelial cells derived from nondiabetic and T1D individuals. (B) MTOR bisulfite sequencing. Data are represented as a single DNA molecule from 1 sample from each group. Open circles, unmethylated CG; solid circles, methylated CG. (C) MTOR methylation analysis using methyl–qPCR. (D) MTOR mRNA levels in human endothelial cells stimulated by chronic HG and 5adC. qRT-PCR data are shown relative to H3F3A. Significance in C and D was calculated by comparing normal glucose (NG) vs. high glucose (HG), NG vs. NG + 5-aza-2′-deoxycytidine (5adC), and NG vs. HG + 5adC (n = 3). (E) Schematic of DMRs validated in the FinnDiane cohort overlapping the CTCF and Pol2B binding motifs proximal to MTOR exon 7. CTCF and Pol2B binding was assessed by ChIP-qPCR and signals were adjusted to an IgG antibody control. Regions of interest amplified are the CTCF binding sites on MTOR. Significance was calculated by comparing to NG control (n = 3). (F) CTCF ChIP assay combined with bisulfite sequencing upstream of exon 7 of the MTOR gene. Open circles, unmethylated CG; solid circles, methylated CG. (G) MTOR exon–specific qRT-PCR assay in human vascular endothelial cells. mRNA levels reported relative to NG (n = 5). (H) MTOR qRT-PCR data from primary human aortic endothelial cells isolated from healthy and T1D individuals (n = 3). (I) MTOR methylation analysis in primary endothelial cells using methyl-qPCR. DNA methylation was further reduced in diabetic cells exposed to HG. (J) CTCF and Pol2B binding was reduced in hyperglycemic conditions. Significance in I and J was calculated by comparing healthy vs. healthy + HG, diabetic vs. diabetic + HG, and healthy vs. diabetic + HG (n = 3). Experiments were performed on cells from passages 4 to 7. *P < 0.05, **P < 0.01 by 2-tailed Student’s t test. Error bars are SEM.

