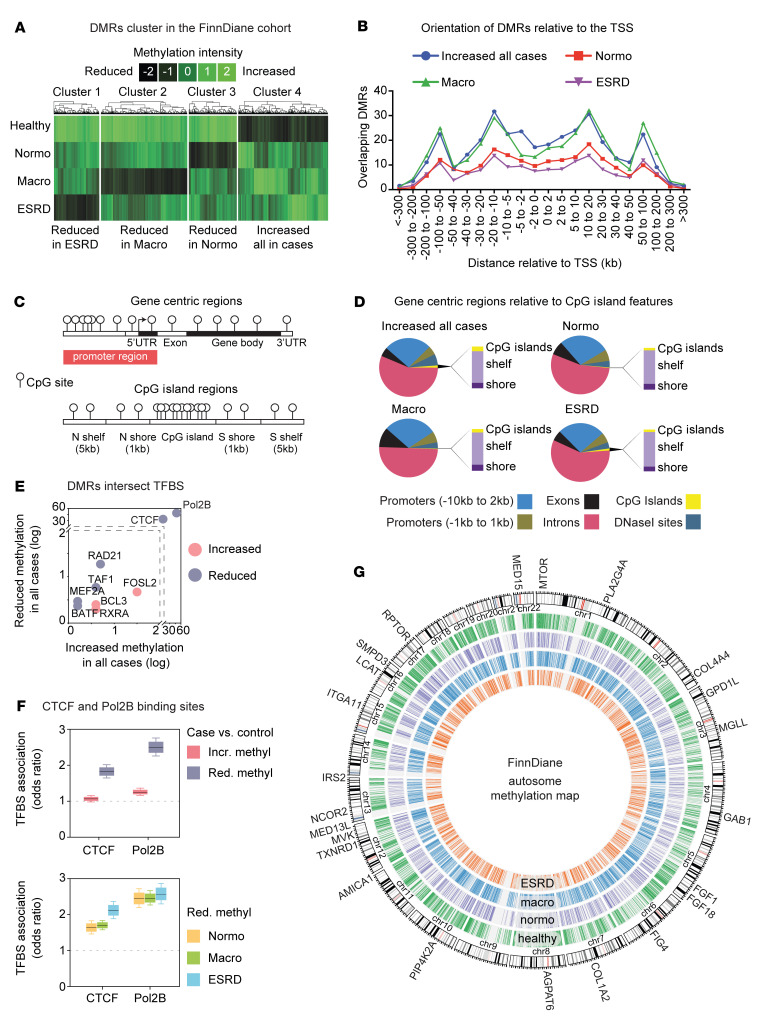
Figure 2. FinnDiane T1D methylome at sites of regulation.
(A) Hierarchical profile-based clustering of DMRs. DNA methylation differences detected between controls and cases with normoalbuminuria (Normo), macroalbuminuria (Macro), and end-stage renal disease (ESRD). Heatmap shows loss (black) and gain (green) of methylation. We observed clustering of DMRs by the prevalence of DN (P value < 0.01). (B) Binned orientation and distance of DMRs relative to transcription start site (TSS). (C) Graphical representation of genomic features and CG islands, shelves, and shores. (D) Distribution of DMR clusters shown at gene promoters, exons, introns, CG islands (CGI), and CG island shores (±1 kb from CGI) and shelves (±1–5 kb from CGI). The majority of CG differences occur at gene intronic regions. (E) Scatterplot of DMR overlap with TFBSs (ENCODE data). The x axis shows increased methylation at sites compared with reduced methylation at sites in T1D cases (y axis). TFBSs that associate with DMRs are shown as increased in methylation (pink) circles and reduced in methylation (purple) in T1D cases when compared with healthy controls. Criteria for TFBS overlap with DMRs was set to 50%. (F) CTCF and Pol2B binding sites are overrepresented at DMRs with reduced methylation in T1D cases when compared with healthy controls. Within each box, horizontal black lines denote median values; boxes extend from the 25th to the 75th percentile of each group’s distribution and the whisker denote the 5th and 95th percentiles. CTCF and Pol2B binding sites were overrepresented at sites of reduced methylation in diabetics that developed renal complications. All P values < 0.001. (G) Atlas of DNA methylation from FinnDiane discovery cohort. Human chromosome ideogram of DMRs clustered by DN (P < 0.01). The outermost track is organized by autosomes, showing several methylation-dependent genes. The centromere of each chromosome (chr) is represented by a double red line. The second track represents a genomic view of 3362 regions with increased methylation in all cases (hypomethylated in healthy group) (green, P < 0.01). The second track represents 1792 regions with decreased methylation in the Normo group (purple, P < 0.01). The fourth track represents the Macro group with 3227 regions with decreased methylation (blue, P < 0.01). The fifth track represents the genomic view of 1697 regions with decreased methylation detected in the ESRD group (orange, P < 0.01).

