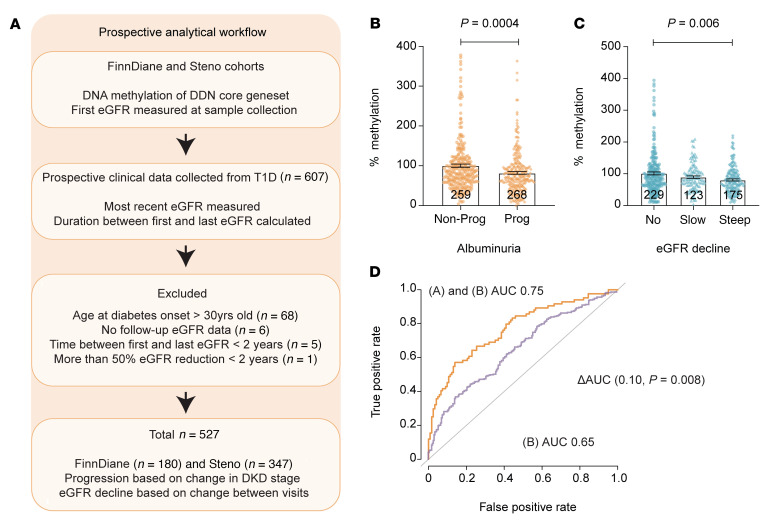
Figure 6. Prospective data analysis of FinnDiane replication and PROFIL validation cohorts.
(A) Schema of prospective data analysis in FinnDiane and PROFIL cohorts — data were obtained prospectively to evaluate disease progression by also including follow-up eGFR from 527 individuals with T1D. (B) Reduced DNA methylation is a feature of albuminuria progression. DNA methylation analysis of genes associated with the DDNs, including MTOR, RPTOR, IRS2, COL1A2, TXNRD1, LCAT, and SMPD3. Samples from these T1D cohorts were classified as nonprogressors and progressors based on change in albuminuria stages (Normo to Micro; Micro to Macro; Macro to ESRD). Changes in DNA methylation for the different groups are presented as bar graphs (combined core genes for each sample in different groups). Error bars represent SEM, and the statistical significance was calculated by comparing nonprogressors and progressors using the Mann-Whitney U test. (C) Reduced DNA methylation is a feature of eGFR decline. DNA methylation analysis of the core genes in the FinnDiane and PROFIL cohorts based on eGFR decline in slope. eGFR decline is defined as the calculated estimated glomerular filtration slope by comparing the difference in the first (with matching DNA methylation readout) and last eGFR measurements as an index of follow-up time in years. No decline is defined as an eGFR slope of –1 mL/min/1.73 m2 or greater. Slow decline is defined by an eGFR slope of greater than –3 and less than –1 mL/min/1.73 m2. Steep decline is defined by an eGFR slope of less than –3 mL/min/1.73 m2. Error bars represent SEM and the significance was calculated by comparing no decline with slow and steep decline groups using the Mann-Whitney U test. Reduced DNA methylation associates with steep eGFR decline (P = 0.006). (D) DNA methylation index improves prediction of eGFR decline. ROC plot shows the AUC score for combined clinical factors (DM duration, HbA1c, UACR, smoking, and systolic blood pressure) 0.65, P = 4.08 × 10⁻⁷ (green). The inclusion of DNA methylation index improves the AUC score of combined clinical factors from 0.65 to 0.75 (P = 7.75 × 10⁻⁷) in predicting eGFR decline in the FinnDiane and PROFIL cohorts (Δ AUC 0.10; P = 0.008). The model for (A) combined core gene methylation and (B) clinical factors reports the combined result of gene methylation with individual covariates and shown in Table 1. P values were processed using bootstrap in R.

