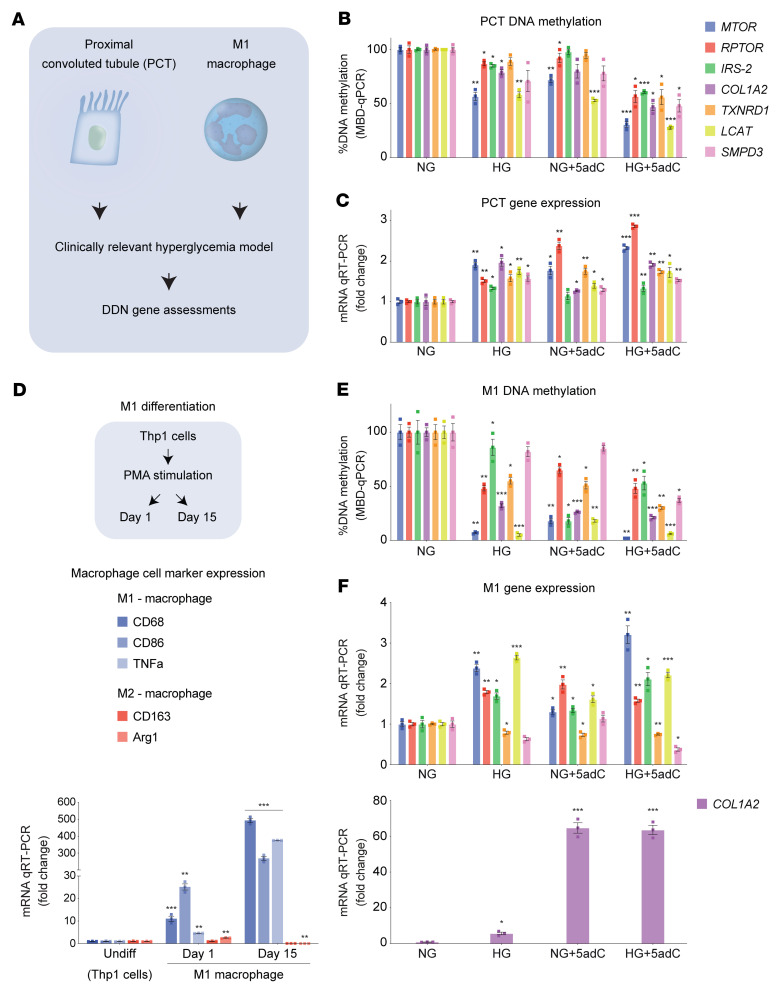
Figure 9. Hyperglycemia influences the DDNs in proximal tubule cells and macrophages.
(A) Overview of experiments: culture conditions and experimental procedures used to assess core gene methylation and mRNA expression. Human proximal convoluted tubule cells and M1 macrophages (THP-1+ monocyte–derived) were cultured in physiological glucose conditions, high glucose (HG), and 5-aza-2′-deoxycytidine (5adC). (B) MTOR, RPTOR, IRS2, COL1A2, TXNRD1, LCAT, and SMPD3 were assessed using methyl–qPCR in PCT cells exposed to normal glucose (NG) for 15 days or NG for 15 days including 3 days with 5adC (NG + 5adC), HG for 15 days (HG), and HG including 3-days with 5adC (HG + 5adC) (n = 3). (C) mRNA levels of core genes assessed in PCT cells stimulated by chronic HG and 5adC. qRT-PCR data are shown relative to H3F3A (n = 3). (D) Macrophage differentiation from THP-1+ monocytes treated with phorbol-12-myristate-13-acetate (PMA) for 1 day and 15 days. Expression of macrophage-specific markers CD68, CD86, and TNFA (M1 macrophages) and CD163 and ARG1 (M2 macrophages) assessed by qRT-PCR. Data are shown relative to H3F3A (n = 3). (E) Methylation analysis of core genes in M1 macrophages (differentiated THP-1 day 15) exposed to HG and/or 5adC (n = 3). (F) mRNA levels of core genes assessed in M1 macrophages stimulated by chromic HG and 5adC. Data are shown relative to H3F3A. Significance was calculated using 2-tailed Student’s t test by comparing NG vs. HG, NG vs. NG + 5adC, and NG vs. HG + 5adC (B, C, E, and F) or by comparing undifferentiated vs. day 1 and undifferentiated vs. day 15 (D). *P < 0.05, **P < 0.01, ***P < 0.001. Error bars are SEM.

