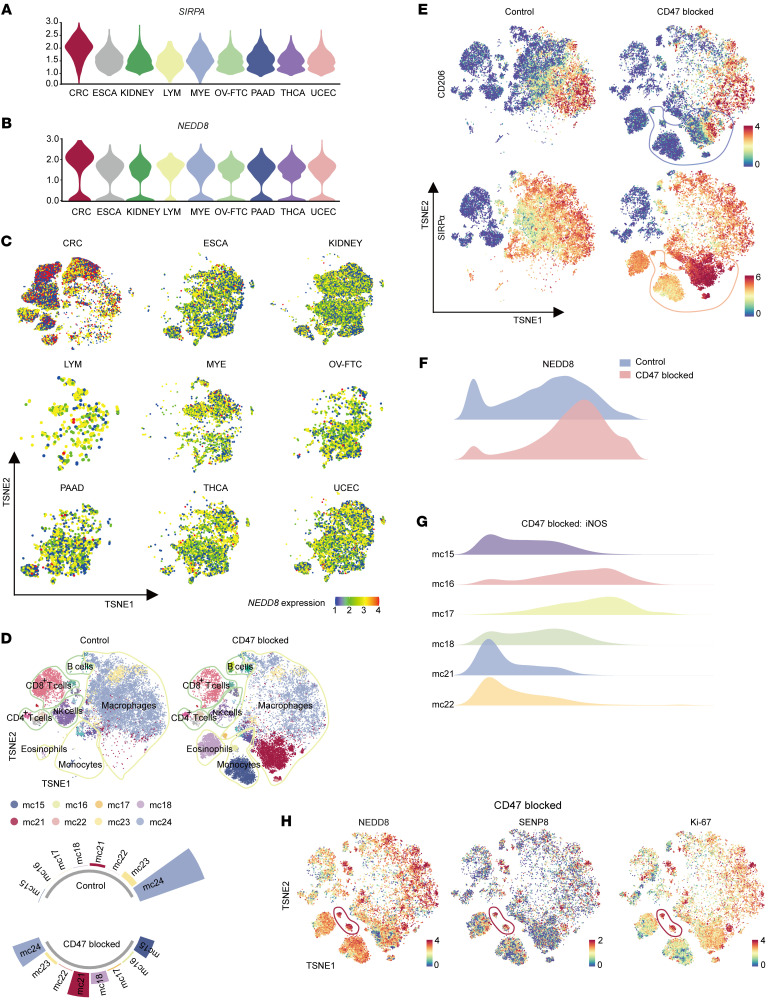
Figure 1. Neddylation and SENP8 play a regulatory role in response to CD47 stimulation.
(A) Violin plot of SIRPA gene expression levels in different TIMs. (B) Violin plot of NEDD8 gene expression levels in SIRPα+ TIMs. (C) TSNE plots of NEDD8 gene expression levels in tumor-infiltrating myeloid cells. ESCA, esophageal carcinoma; KIDNEY, kidney cancer; LYM, lymphoma; MYE, myeloma; OV-FTC, ovarian or fallopian tube carcinoma; PAAD, pancreatic adenocarcinoma; THCA, thyroid carcinoma; UCEC, uterine corpus endometrial carcinoma. (D) TSNE plot shows lineages of tumor-infiltrating leukocytes in control (left) and CD47/SIRPα–blocking peptide–treated (Pep-20, 2 mg/kg, right) MC38 s.c. tumors (n = 6). mc numbers refer to major varied mouse clusters. (E) TSNE visualization of CD206 and SIRPα expression groups shown in D. (F) NEDD8 expression in total tumor-infiltrating monocytes/macrophages of groups show in D. (G) iNOS expression of major varied mouse clusters of Pep-20–treated groups. (H) TSNE visualization of NEDD8, SENP8, and Ki-67 expression in Pep-20–treated groups; mc16 and mc17 are circled.

