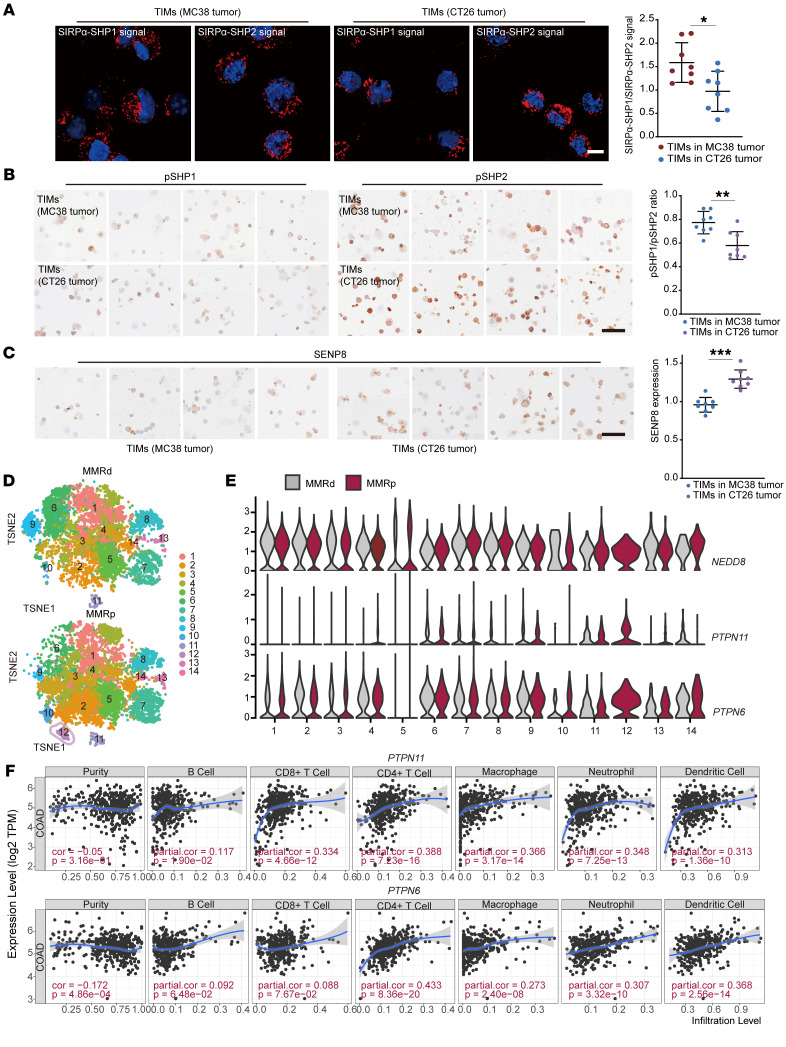
Figure 11. CD47/SIRPα axis relies on SHP2 deneddylation in immunosuppressive CRC microenvironment.
(A) PLA assay showed the interactions between SIRPα and SHP1/SHP2 in indicated TIMs (n = 8). Scale bar: 10 μm. (B) pSHP1 (Y564) and pSHP2(Y542) expression in indicated TIMs (n = 8). Scale bar: 50 μm. (C) SENP8 expression in indicated TIMs (n = 8). Scale bar: 50 μm. (D) TSNEs of TIM clusters in MMRd and MMRp tumor samples. n =28 (MMRd samples); n = 34 (MMRp samples). (E) Violin plot shows expression levels of indicated genes of different clusters in MMRd and MMRp tumor samples. PTPN11 encodes SHP2; PTPN6 encodes SHP1. (F) Association analysis of PTPN11 or PTPN6 gene expression and immune cell infiltration in COAD cohort from the TCGA database. Data are represented as mean ± SD. *P < 0.05; **P < 0.01; ***P < 0.001. Two-tailed, unpaired Student’s t test (A–C); partial correlation (F).

