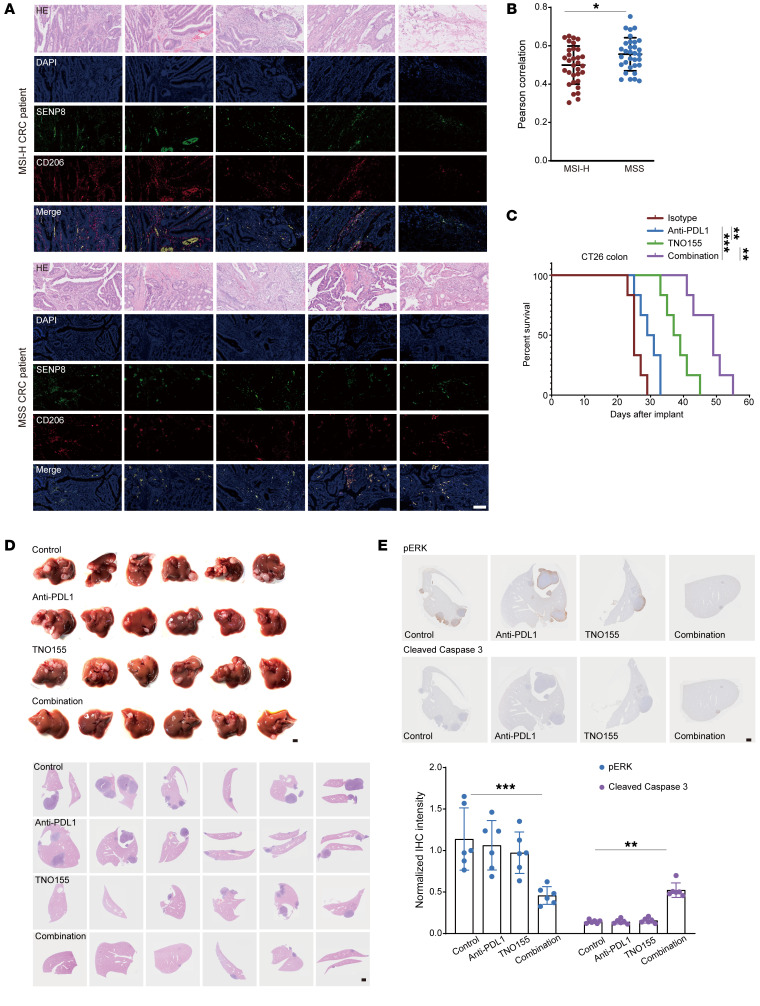
Figure 12. SHP2 inhibition synergizes with immunotherapy to disrupt the immunosuppressive CRC microenvironment.
(A) Immunofluorescence images of MSI-H CRC and MSS CRC (n = 32) staining indicated markers. Scale bars: 100 μm. (B) Pearson’s correlation of SENP8 and CD206 shown in Figure 8A. (C) TNO155 (15 mg/kg, daily intragastric administration from day 5), anti-PDL1 (10 mg/kg, i.p. from day 5 every other day), or a combination of both in CT26 s.c. tumor-bearing mice. Mice with tumor volumes less than 2,000 mm3 are considered as surviving, and survival of mice was monitored (n = 6). (D) Spleen images and H&E staining from the spleen-liver metastasis model of indicated groups (n = 6). Scale bars: 1 mm. (E) IHC staining from the spleen-liver metastasis model of indicated groups (n = 6). Data are represented as mean ± SD. *P < 0.05; **P < 0.01; ***P < 0.001. Two-tailed, unpaired Student’s t test (B); Kaplan-Meier log-rank test (C); 2-way ANOVA followed by Tukey’s post hoc test (E).

