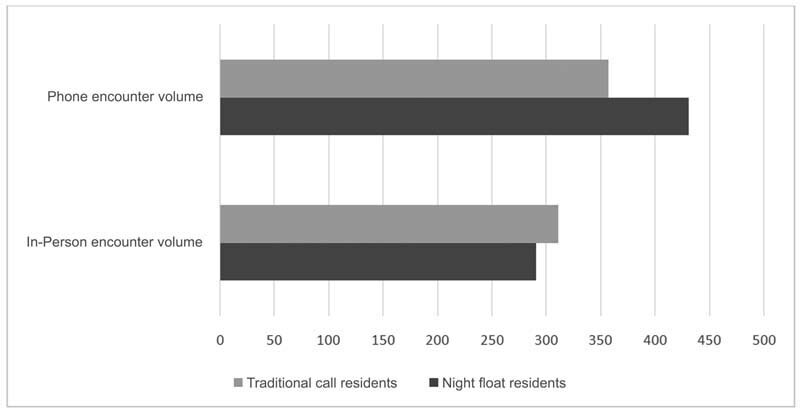
Fig. 3.

Encounter volume, in-person and phone, between residents in the night float system and residents in the traditional call system. There was no significant difference in phone and in-person encounter volumes between the two groups (290.8 ± 30.5 vs. 310.7 ± 25.4, respectively, p = 0.163). The same was true of the after-hours phone consultation volume (430.8 ± 20.2 vs. 357.1 ± 90.0, respectively, p = 0.068).
