


Figure 3. The role of predicted MR dimerization interfaces in quaternary structure formation.
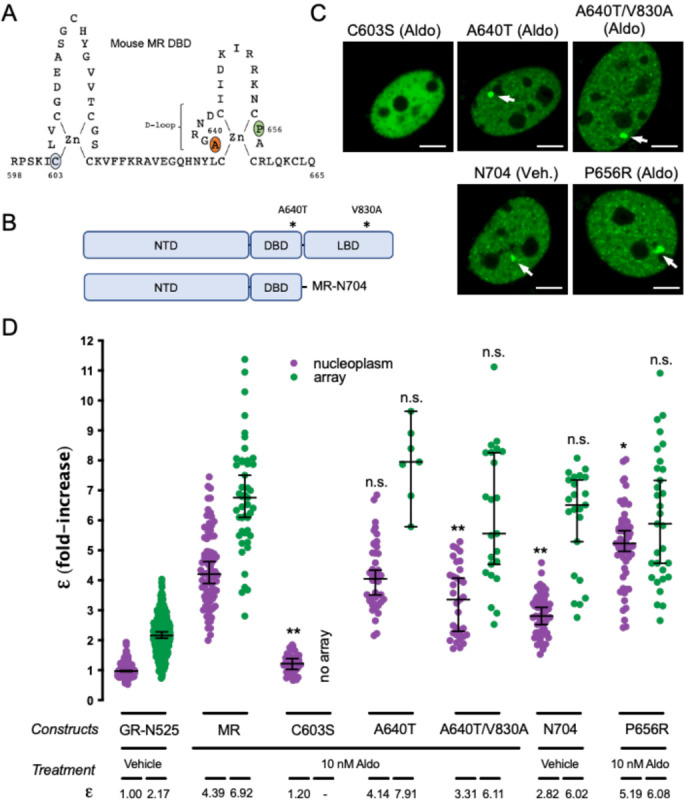
(A) Schematic representation of MR DBD. (B) Schematic representation of MR double mutant (A640T/V830A) and deletion generating construct MR-N704. NTD, N-terminal domain; DBD, DNA binding domain; LBD, ligand binding domain. (C) Representative images of single cell nuclei expressing the indicated constructs. White arrows point to the MMTV array. Scale bars: 5 μm. (D) MR molecular brightness (ε) assessed using the N&B technique. To facilitate comparison, data from Fig.1 showing ε for GR-N525 and MR treated with 10 nM aldosterone are included. Data points correspond to ε obtained from a single nucleus (n = 490, 307, 82, 47, 41, 44, 7, 33, 23, 51, 23, 57 and 31 cells in each condition, from left to right). To facilitate comparison, data from Fig.1 showing ε for GR-N525 and MR treated with 10 nM aldosterone are included. Horizontal bars represent mean ± 95% CI. Each ε value was compared to its reference value (wild type MR in the nucleoplasm or at the MMTV array) using the Kruskal-Wallis test followed by Dunńs multiple comparisons correction. Symbols refer to statistical differences with MR wild type in the same compartment (nucleoplasm or MMTV array; n.s., non-significant; *, p<0.05; **, p<0.01).