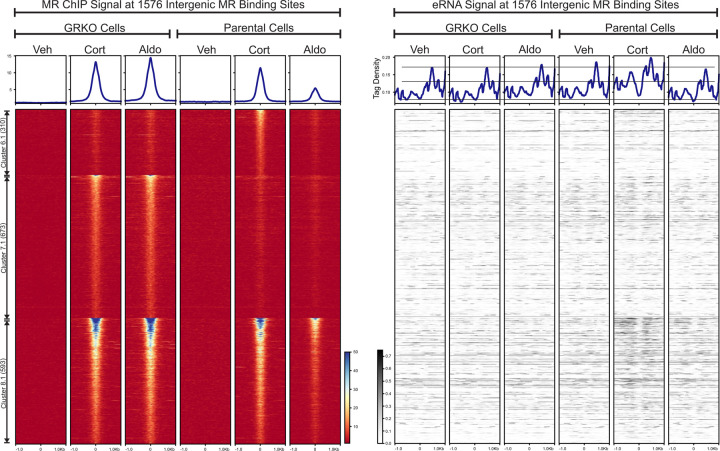
Figure 3.
eRNA Signal at intergenic MR Peaks. The left heatmap shows subsets of clusters 6–8 (Fig 1C) representing intergenic MR ChIP peaks. Aggregate plots represent total ChIP-Seq tag density of all peaks normalized as reads per genomic content (1x normalization). Heatmaps represents ± 1kb around the center of the MR peak. ChIP-Seq intensity scale is noted lower right on a linear scale. Clusters of peaks are labeled on the left with the peak number in parentheses and are sorted from high to low signal for the condition with the highest overall signal. The right heatmap shows total normalized RNA-seq signal from merged replicates in the same order and breadth as the MR-ChIP heatmaps. Aggregate plots represent total RNA-Seq tag density normalized as reads per genomic content (1x normalization). RNA-Seq intensity scale is noted lower left on a linear scale.

