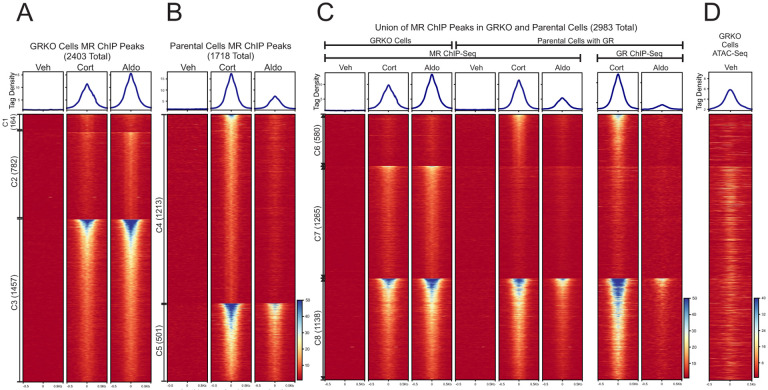
Figure 1. Chromatin binding of MR. A-B.
Comparison of MR binding after 1 Hr. treatment with vehicle, 100nM Cort or 10nM Aldo in two cell lines (GRKO with no GR or Parental with endogenous GR). Aggregate plots represent total ChIP-Seq tag density of all peaks normalized as reads per genomic content (1x normalization). Heatmaps represents ± 500bp around the center of the MR peak. ChIP-Seq intensity scale is noted lower right on a linear scale. Clusters of peaks (C1-C5) are labeled on the left with the peak number in parentheses and are sorted from high to low signal for the condition with the highest overall signal. A small cluster of four Aldo-specific peaks in the parental cells are not shown on the heatmap. C-D. A union list of MR ChIP peaks from A-B was created (see methods) and clustered by cell line and hormone treatment. 2983 unique MR peaks are distributed into Parental-specific/Cort (C6), GRKO-specific/Aldo (C7) or shared between to two cell types (C8). Aggregate plots and heatmaps are displayed as described for A-B for both MR ChIP and endogenous GR ChIP (parental cells only). ATAC-seq data are from untreated GRKO cells with stably expressed GFP-GRwt (31). The ATAC data heatmap is sorted the same as ChIP data in C and intensity scale is noted lower right on a linear scale.

