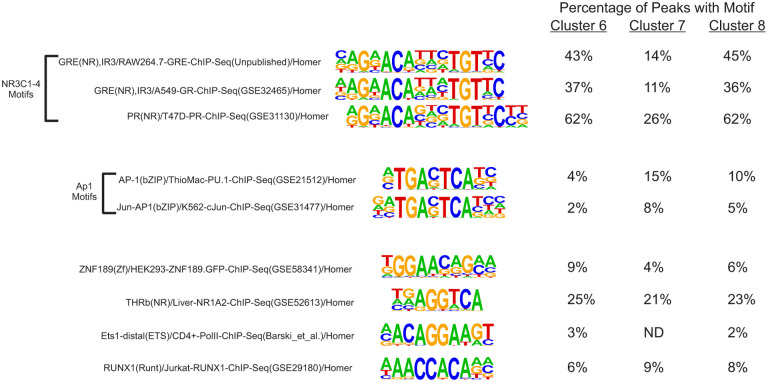
Figure 2. De novo motif analysis of MR binding.
Figure shows position weight matrix logos for known motifs from the HOMER database. For Clusters 6–8, the percentage of MR binding sites that contain the designated known motif. See also Table S2 for numbers of sites containing a designated motif and background information.

