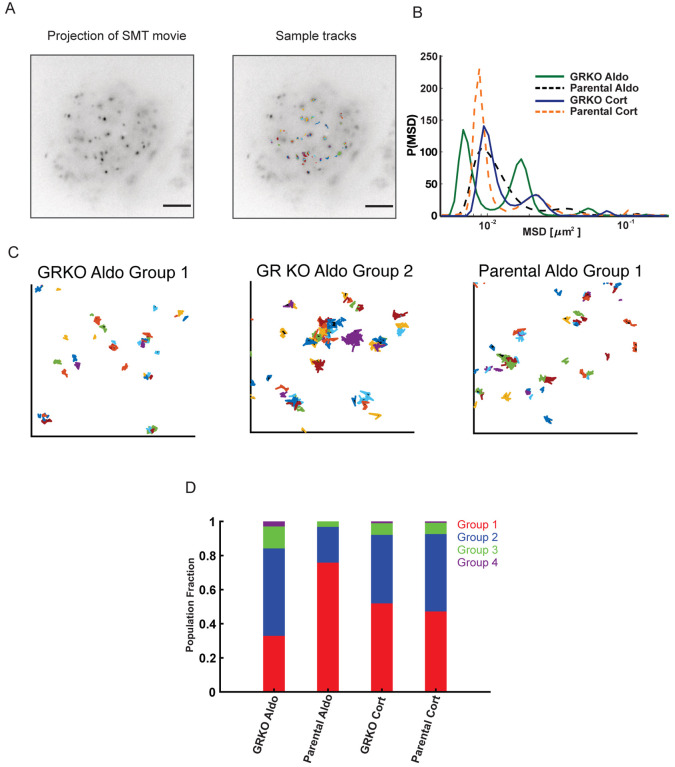
Figure 6. Single molecule tracking of MR.
A. Temporal projection of an MR single molecule tracking movie (left) overlaid with tracks (right). Scale bar 5 μm B. Distribution of MR mean squared displacement (MSD) at a timelag of 0.8 s, obtained by iteratively fitting the van Hove correlation (vHc) function using the Richardson-Lucy algorithm for each of the four conditions – GRKO-Aldo (green solid line), Parental Aldo (black dashed line), GRKO-Cort (blue solid line), Parental-Cort (orange dashed line). C. Representative tracks for MR in the dominant lowest mobility groups. (Left) MR-Aldo group 1 tracks in GRKO cells, (center) MR-Aldo group 2 tracks in GRKO cells, (right) MR-Aldo group 1 tracks in Parental cells. Note that MR-Aldo in Parental cells exhibits a very small fraction of group 2 tracks (see also panel D). D. Population fractions for the different mobility groups for the indicated condition. Ncells/Ntracks: 51/1878 (GRKO MR-Aldo), 51/2000 (GRKO MR-Cort), 57/2419 (Parental MR-Aldo), 60/2036 (Parental MR-Cort). Two biological replicates were collected for each condition.

