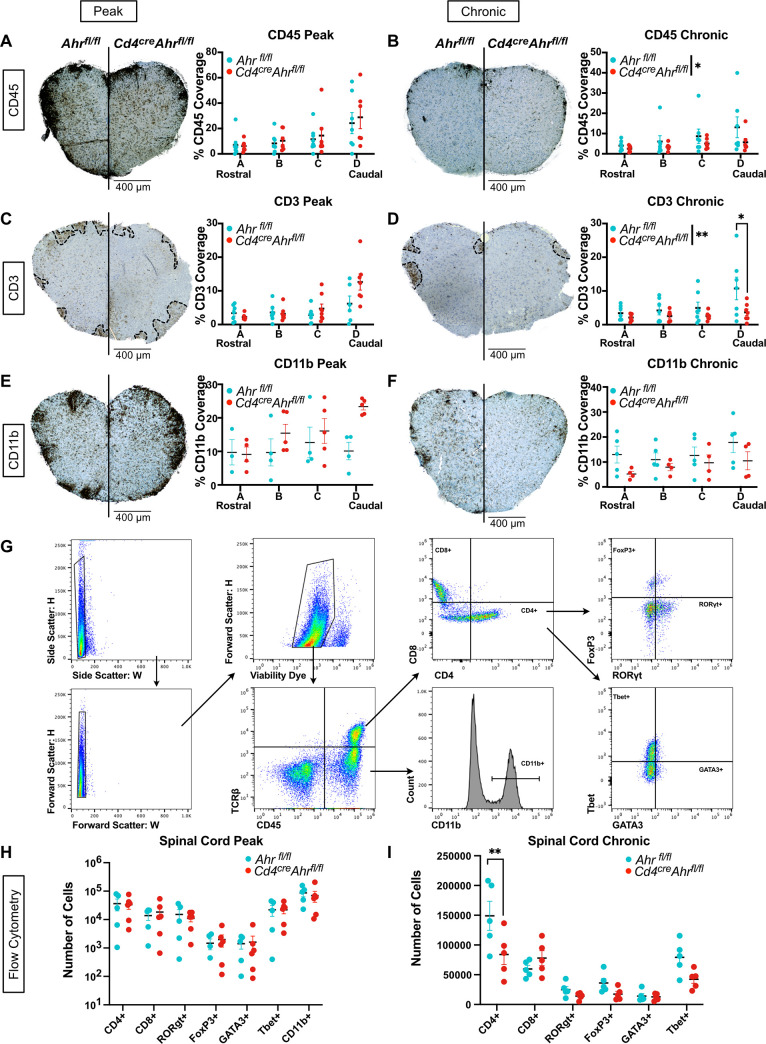
Fig 3. Reduced CD3+ cells in the spinal cord of Cd4creAhrfl/fl mice correlate with clinical signs.
(A) Spinal cords of separately housed Cd4creAhrfl/fl and Ahrfl/fl littermate controls were stained for total immune cells (CD45+) by immunohistochemistry at 4 levels at the peak of disease (day 16 after immunization) (Each dot represents a mouse n = 7 mice/group; N = 2 experiments; two-way ANOVA [p = 0.5336]) (B) or at the chronic phase of disease (day 31 after immunization). (Two-way ANOVA [p = 0.0419]; Sidak’s multiple comparisons test [p = 0.9896, 0.9209, 0.7898, 0.1753]). (C) Spinal cords of separately housed Cd4creAhrfl/fl and Ahrfl/fl littermate controls were stained for T cells (CD3+) by immunohistochemistry at 4 levels at the peak of disease (day 16 after immunization) (n = 7 mice/group; N = 2 experiments, two-way ANOVA [p = 0.0830]) (D) or at chronic phase of disease (day 31 after immunization). (n = 7 mice/group; N = 2 experiments, two-way ANOVA [p = 0.0054]; Sidak’s multiple comparisons test [p = 0.9578, 0.9029, 0.7095, 0.0070]). (E) Spinal cords of separately housed Cd4creAhrfl/fl and Ahrfl/fl littermate controls were stained for macrophages (CD11b+) by immunohistochemistry at 4 levels at the peak of disease (day 16 after immunization) (n = 4–5 mice/group; N = 2 experiments; two-way ANOVA [p = 0.1271]) (F) or at chronic phase of disease (day 31 after immunization). (n = 5 mice/group; N = 2 experiments, two-way ANOVA [p = 0.2269]). (G) Gating strategy for flow cytometry analysis of immune cells isolated from dissociated spinal cord tissue (H) at peak of disease (day 16 after immunization) (n = 5–6/group; multiple unpaired t tests with Benjamini and Yekutieli corrections [p values listed in the Supporting information (S1 Data)]), (I) or chronic phase of disease (day 31 after immunization) (n = 5 mice/group; multiple unpaired t tests with Benjamini and Yekutieli corrections [p values listed in the Supporting information (S1 Data)]). Scale bars represent 400 μm. Error bars represent standard error from the mean. Raw data can be found in Supporting information (S1 Data).

