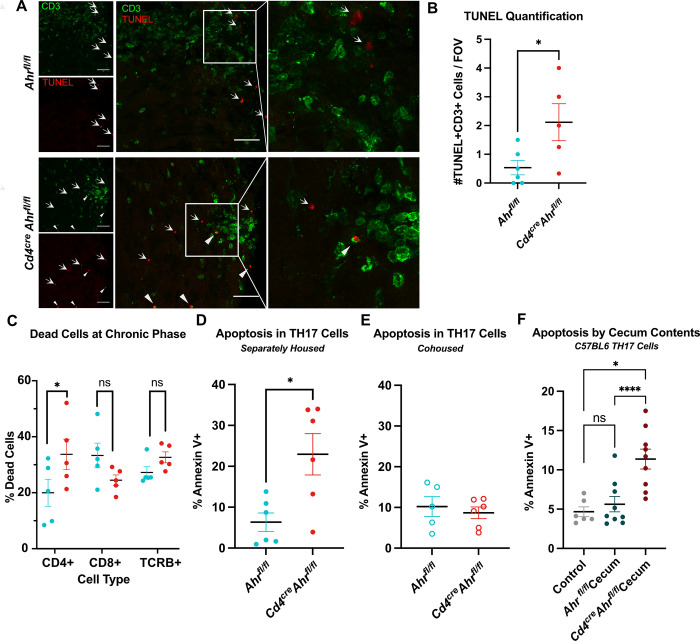
Fig 4. T cell apoptosis is increased in animals who recover from EAE.
(A) Representative image of spinal cords stained with TUNEL assay and T cell marker (CD3) at the peak of disease. Closed triangles indicate TUNEL+CD3+ cells and arrows indicate TUNEL+CD3- cells. Scale bar = 25 μm. (B) Quantification of the number of TUNEL+ T cells (2–6 lesion sites averaged per animal; n = 5–6 mice; N = 2 EAE experiments; unpaired t test [p = 0.0357]). (C) T cells isolated from the spinal cord at the peak of disease stained with viability dye and measured by flow cytometry. Cells gated on singlets, CD45+, gate shown on x-axis, then dead cells (n = 5 mice/group; two-way ANOVA [p = 0.0192] with Sidak’s multiple comparison tests [p = 0.0465, 0.2862, 0.6800]). (D) T cells skewed to TH17 in vitro from separately housed Cd4creAhrfl/fl mice stained for apoptotic marker Annexin V 24 h after stimulation with anti-CD3 antibody. (n = 6 mice/group; N = 2 experiments; unpaired t test [p = 0.0133]). (E) TH17 cells from cohoused Cd4creAhrfl/fl and Ahrfl/fl mice show no differences in the number of Annexin V positive cells 24 h after stimulation with anti-CD3 antibody. (n = 5–6 mice/group; N = 2 experiments; unpaired t test [p = 0.5851]). (F) In vitro differentiated TH17 cells from C57BL6/J mice were exposed to the <3 kDa fraction of cecal contents from Ahrfl/fl and Cd4creAhrfl/fl mice for 24 h with anti-CD3 stimulation. (n = 6–9 mice/group; N = 3 experiments; mixed-effects analysis, with Geisser–Greenhouse correction [p = 0.0013]; Tukey’s post hoc analysis [Ctr vs. Fl p = 0.7729; Ctr vs. Cre p = 0.0333, Fl vs. Cre p < 0.0001]). Error bars represent standard error from the mean. Raw data can be found in Supporting information (S1 Data). EAE, experimental autoimmune encephalomyelitis.

