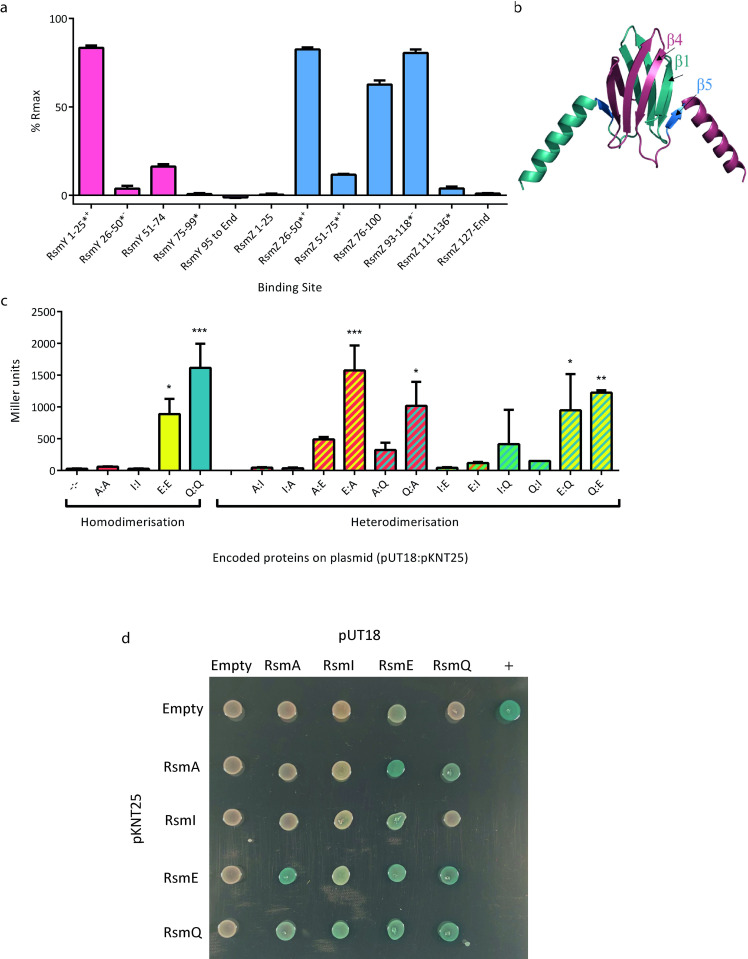
Fig 5. RsmQ can both homo- and heterodimerise.
(a) Percentage Rmax values for RsmQ binding to portions of the ncRNAs RsmY (pink) and RsmZ (blue) showing preferential binding to ssDNAs that contained the binding site in a hairpin loop. Error bars show the standard deviation of 2 replicates and oligos containing a AnGGA binding site are indicated with a (*), with those that have the full AnGGA binding site at the top of a stem loop (+) and with the shorter GGA at the top of a stem loop (-) indicated. (b) AlphaFold model of RsmQ suggests that it forms homodimers (monomers shown in contrasting colours), with the RNA-binding region highlighted in marine (B5). (c) Quantitative bacterial-2-hybrid β-galactosidase assays showing interactions between pUT18c and pKNT25 fusions are shown for RsmA (A), RsmE (E), RsmI (I) and RsmQ (Q). Results were analysed by a one-way ANOVA (p < 0.0001) with Tukey’s multiple comparisons against the empty plasmid control (-:-) indicated (*p < 0.05, **p < 0.01, ***p < 0.001, ****p < 0.0001). Error bars represent the standard deviation of 2 biological replicates. Additional controls are shown in S7 Fig. (d) Representative image of qualitative β-galactosidase assays on agar plates. pKT25 fusions are shown in rows and pUT18c fusions in columns, with the indicated protein/empty vector present in each case. Data are available in S4 Data. ssDNA, single-stranded DNA.

