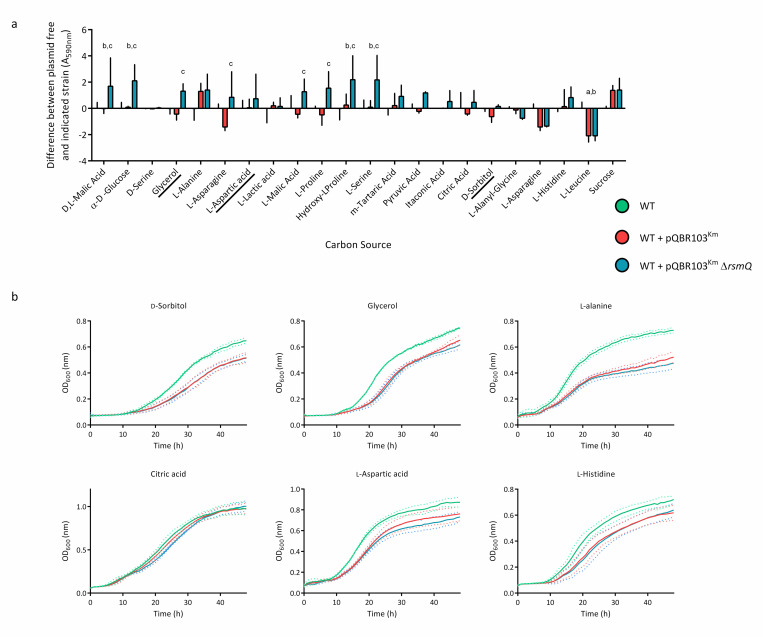
Fig 8. RsmQ is involved in the control of carbon source metabolism.
(a) Selected results from BioLog carbon source screens showing metabolism with relevant carbon sources after 48 h of static incubation at 28°C. Data are shown for SBW25 cells carrying pQBR103Km (red) and pQBR103Km-ΔrsmQ (blue) compared to average SBW25 plasmid free (green) for each carbon source. Error bars show standard deviation. A two-way ANOVA showed a significant effect of strain and carbon source (p < 0.0001) as well as a significant interaction (p < 0.01). Multiple comparisons compared SBW25 plasmid free, SBW25 +pQBR103Km and SBW25 +pQBR103Km- ΔrsmQ within each carbon source. Significant differences are indicated above for SBW25/SBW25 +pQBR103Km (a), SBW25/SBW25 +pQBR103Km-ΔrsmQ (b), and SBW25 +pQBR103Km /SBW25 +pQBR103Km-ΔrsmQ (c) for p < 0.05. Data for all carbon sources can be seen in S10 Fig and S2 Table. (b) Growth curves are shown for SBW25 (green), SBW25 cells carrying pQBR103Km (red), and pQBR103Km-ΔrsmQ (blue), with the mean growth for 3 biological replicates shown as a solid line and standard deviation shown as dotted lines. Cells were grown for 48 h at 28°C without shaking in M9 minimal media with 0.4% w/v either D-sorbitol, glycerol, L-alanine, citric acid, L-aspartic acid, L-histidine as indicated. Data are available in S7 Data. WT, wild-type.

