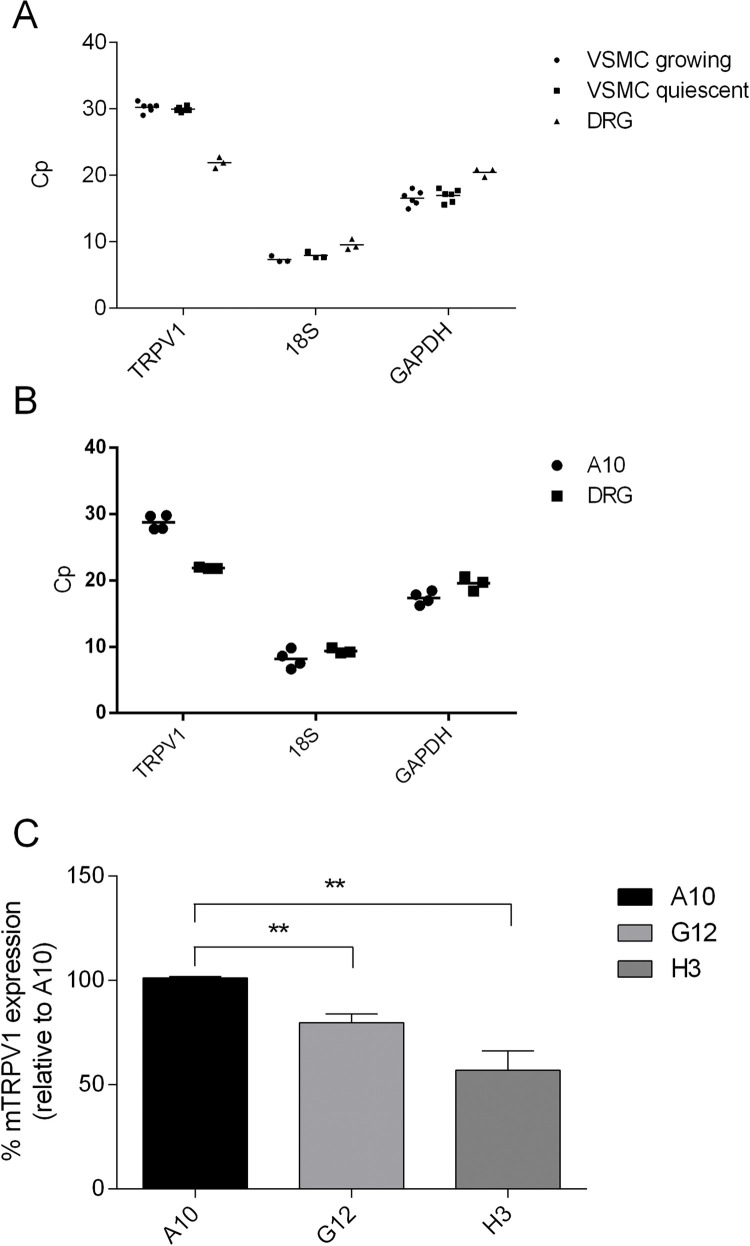
Fig 5. Expression of TRPV1 mRNA in cultured primary VSMC and in CRISPR/Cas-edited A10 cell line.
TRPV1, GAPDH and 18S mRNA expression levels in growing and quiescent VSMCs (A), and in A10 cell line (B) determined by RT qPCR; (A and B) the graphs show Cp values from each independent biological experiment. DRG was used as a positive control. (C) Relative TRPV1 mRNA expression in CRISPR/Cas-edited A10 cells, compared to their normal counterpart; graph shows mean ± SD in the form of percentage relative to the amount of TRPV1 transcript in normal A10 cells of 4 independent biological experiments, each performed in triplicate (** P < 0.01; one-way ANOVA, Tukey post-hoc test). GAPDH was used as a housekeeping gene control.

