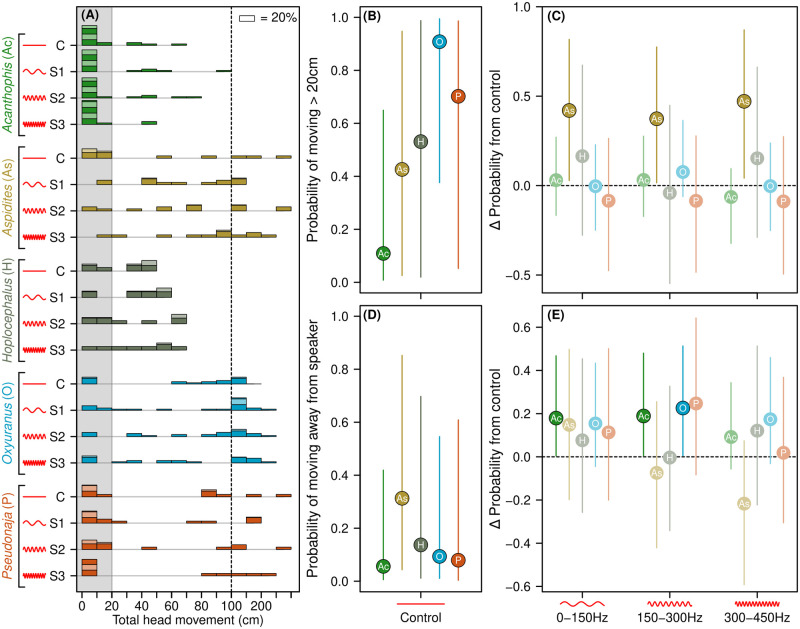
Fig 4. Snake movement in response to sound compared to controls.
(A) Histogram of snake movement by genus (colored groupings) and sound treatment (C, S1-S3) (n = 4 per treatment per snake). Histogram bars are grouped in units of 10cm, except above 100cm (right of dashed line) where they are grouped in units of 50cm. Alternating colors on bars represent blocks of up to 20% of trials. Grey shading indicates the cut-off used to distinguish 20cm threshold for binary movement response used in probability model. (B) Mean probability of >20cm snake movement in control (n = 4 per snake). (C) Change in probability of movement from the control to each of three sound treatments. Values above zero (dashed line) indicate increase in probability, and vice versa. (D) Mean probability of movement away from speaker for each genus in control trials, using only snakes with >20cm of movement. (E) Change in probability of movement away from speaker compared to control means for each of three sound treatments, as per (B). Lines in (B-E) represent 95% credible intervals from Bayesian hierarchical models. Points in C and E with 95% credible intervals that do not cross zero are highlighted as significant effects.

