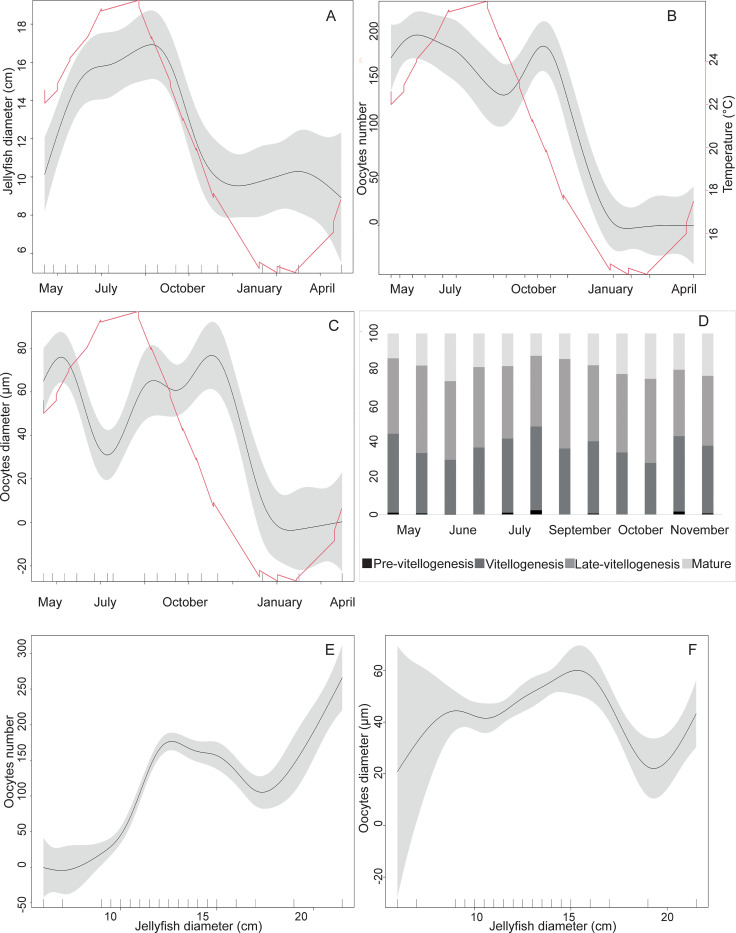
Fig 3. Representation of the temporal pattern of reproduction.
(A) Jellyfish diameter (in cm) during the sampling period from May to April (B) Oocytes number per section area (mm2) during the sampling period showing two seasonal peaks (late spring and autumn) and seasonal temperatures (C) Oocytes diameter during the sampling period and seasonal temperatures (D) Percentage of each oocyte maturation stage during the whole sampling period. There are two columns for each sampling date (E) Oocytes number in relation to the jellyfish diameter (F) Oocytes diameter in relation to jellyfish diameter. Graphs A, B, C, E, F: The black line represents the mean value while grey areas represent the confidence interval. Temperature is plotted in red.

