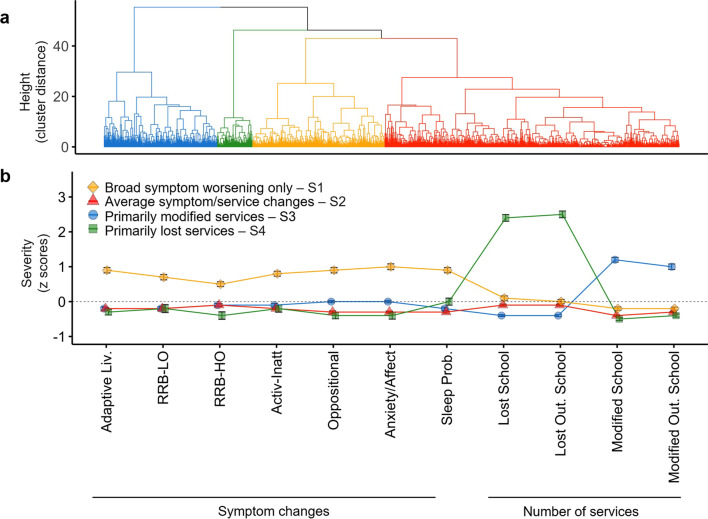
Fig. 4.
Clustering results and COVID-19 Impact Subgroup Patterns. a The dendrogram shows the optimal 4-cluster solution of COVID-19 Impact including: broad symptom worsening only (n = 251; 20%, yellow), primarily modified services (n = 293; 23%, blue), primarily lost services (n = 78; 6%, green), and average symptom/service changes (n = 653; 53%, red). b Groups means and standard error bars of the z scored symptom factor changes (difference between Current and Prior scores; or Δ) and number of services lost or modified in and outside (Out.) of school are shown for each cluster (i.e., outcome subgroup). The dotted gray horizontal line at a z score 0 represents the average of the aggregate sample (N = 1275) across each variable examined. Abbreviations: Adaptive Liv., Adaptive Living skills; RRB-LO, Restricted and Repetitive Behaviors—Lower Order; RRB-HO, Restricted and Repetitive Behaviors—Higher Order; Activ-Inatt, Activity Inattention; Sleep Prob., Sleep Problems; Out., Outside; and Mod., Modified

