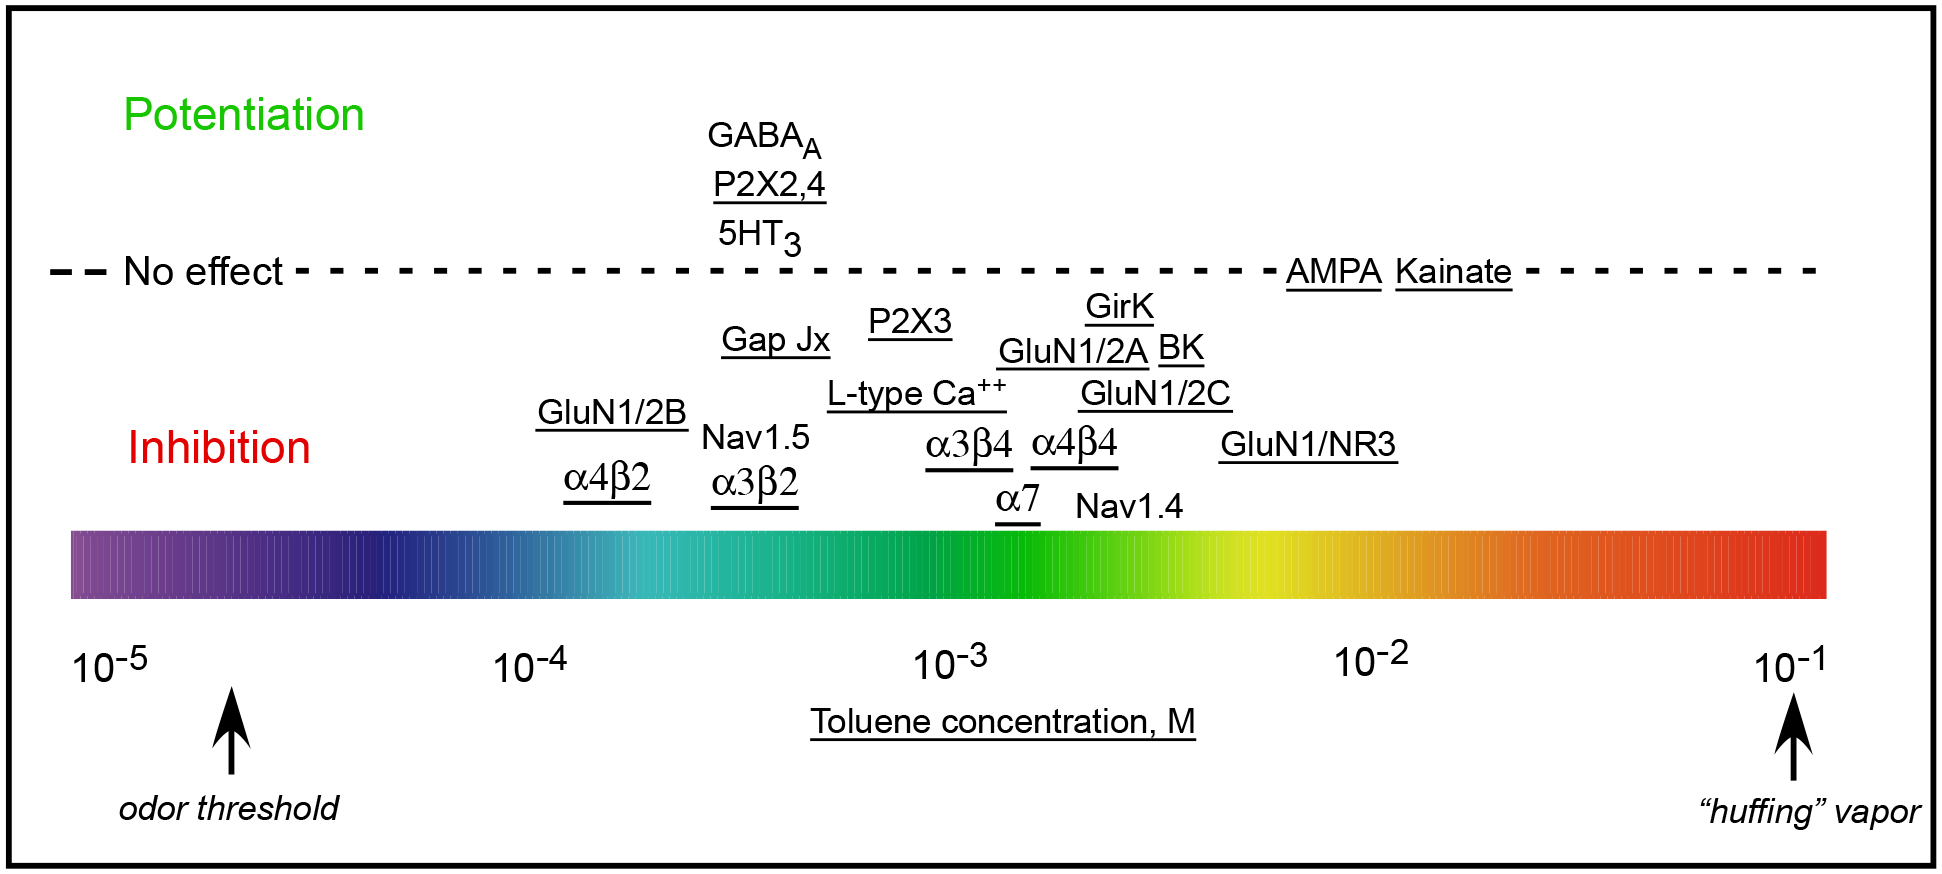
Figure 1.

Summary of toluene’s effect on selected recombinant ion channels. Color bar at bottom shows toluene concentrations ranging from odor threshold (left) to that associated with voluntary inhalation (right). Position of the channel subtype along the color bar indicates degree of sensitivity to toluene while position relative to the dotted horizontal line indicates inhibition (below), potentiation (above) or no effect (on the line). Underlined channel indicates data from the author’s laboratory. Figure updated from Beckley and Woodward, 2013 and used with permission.
