
Figure 5:
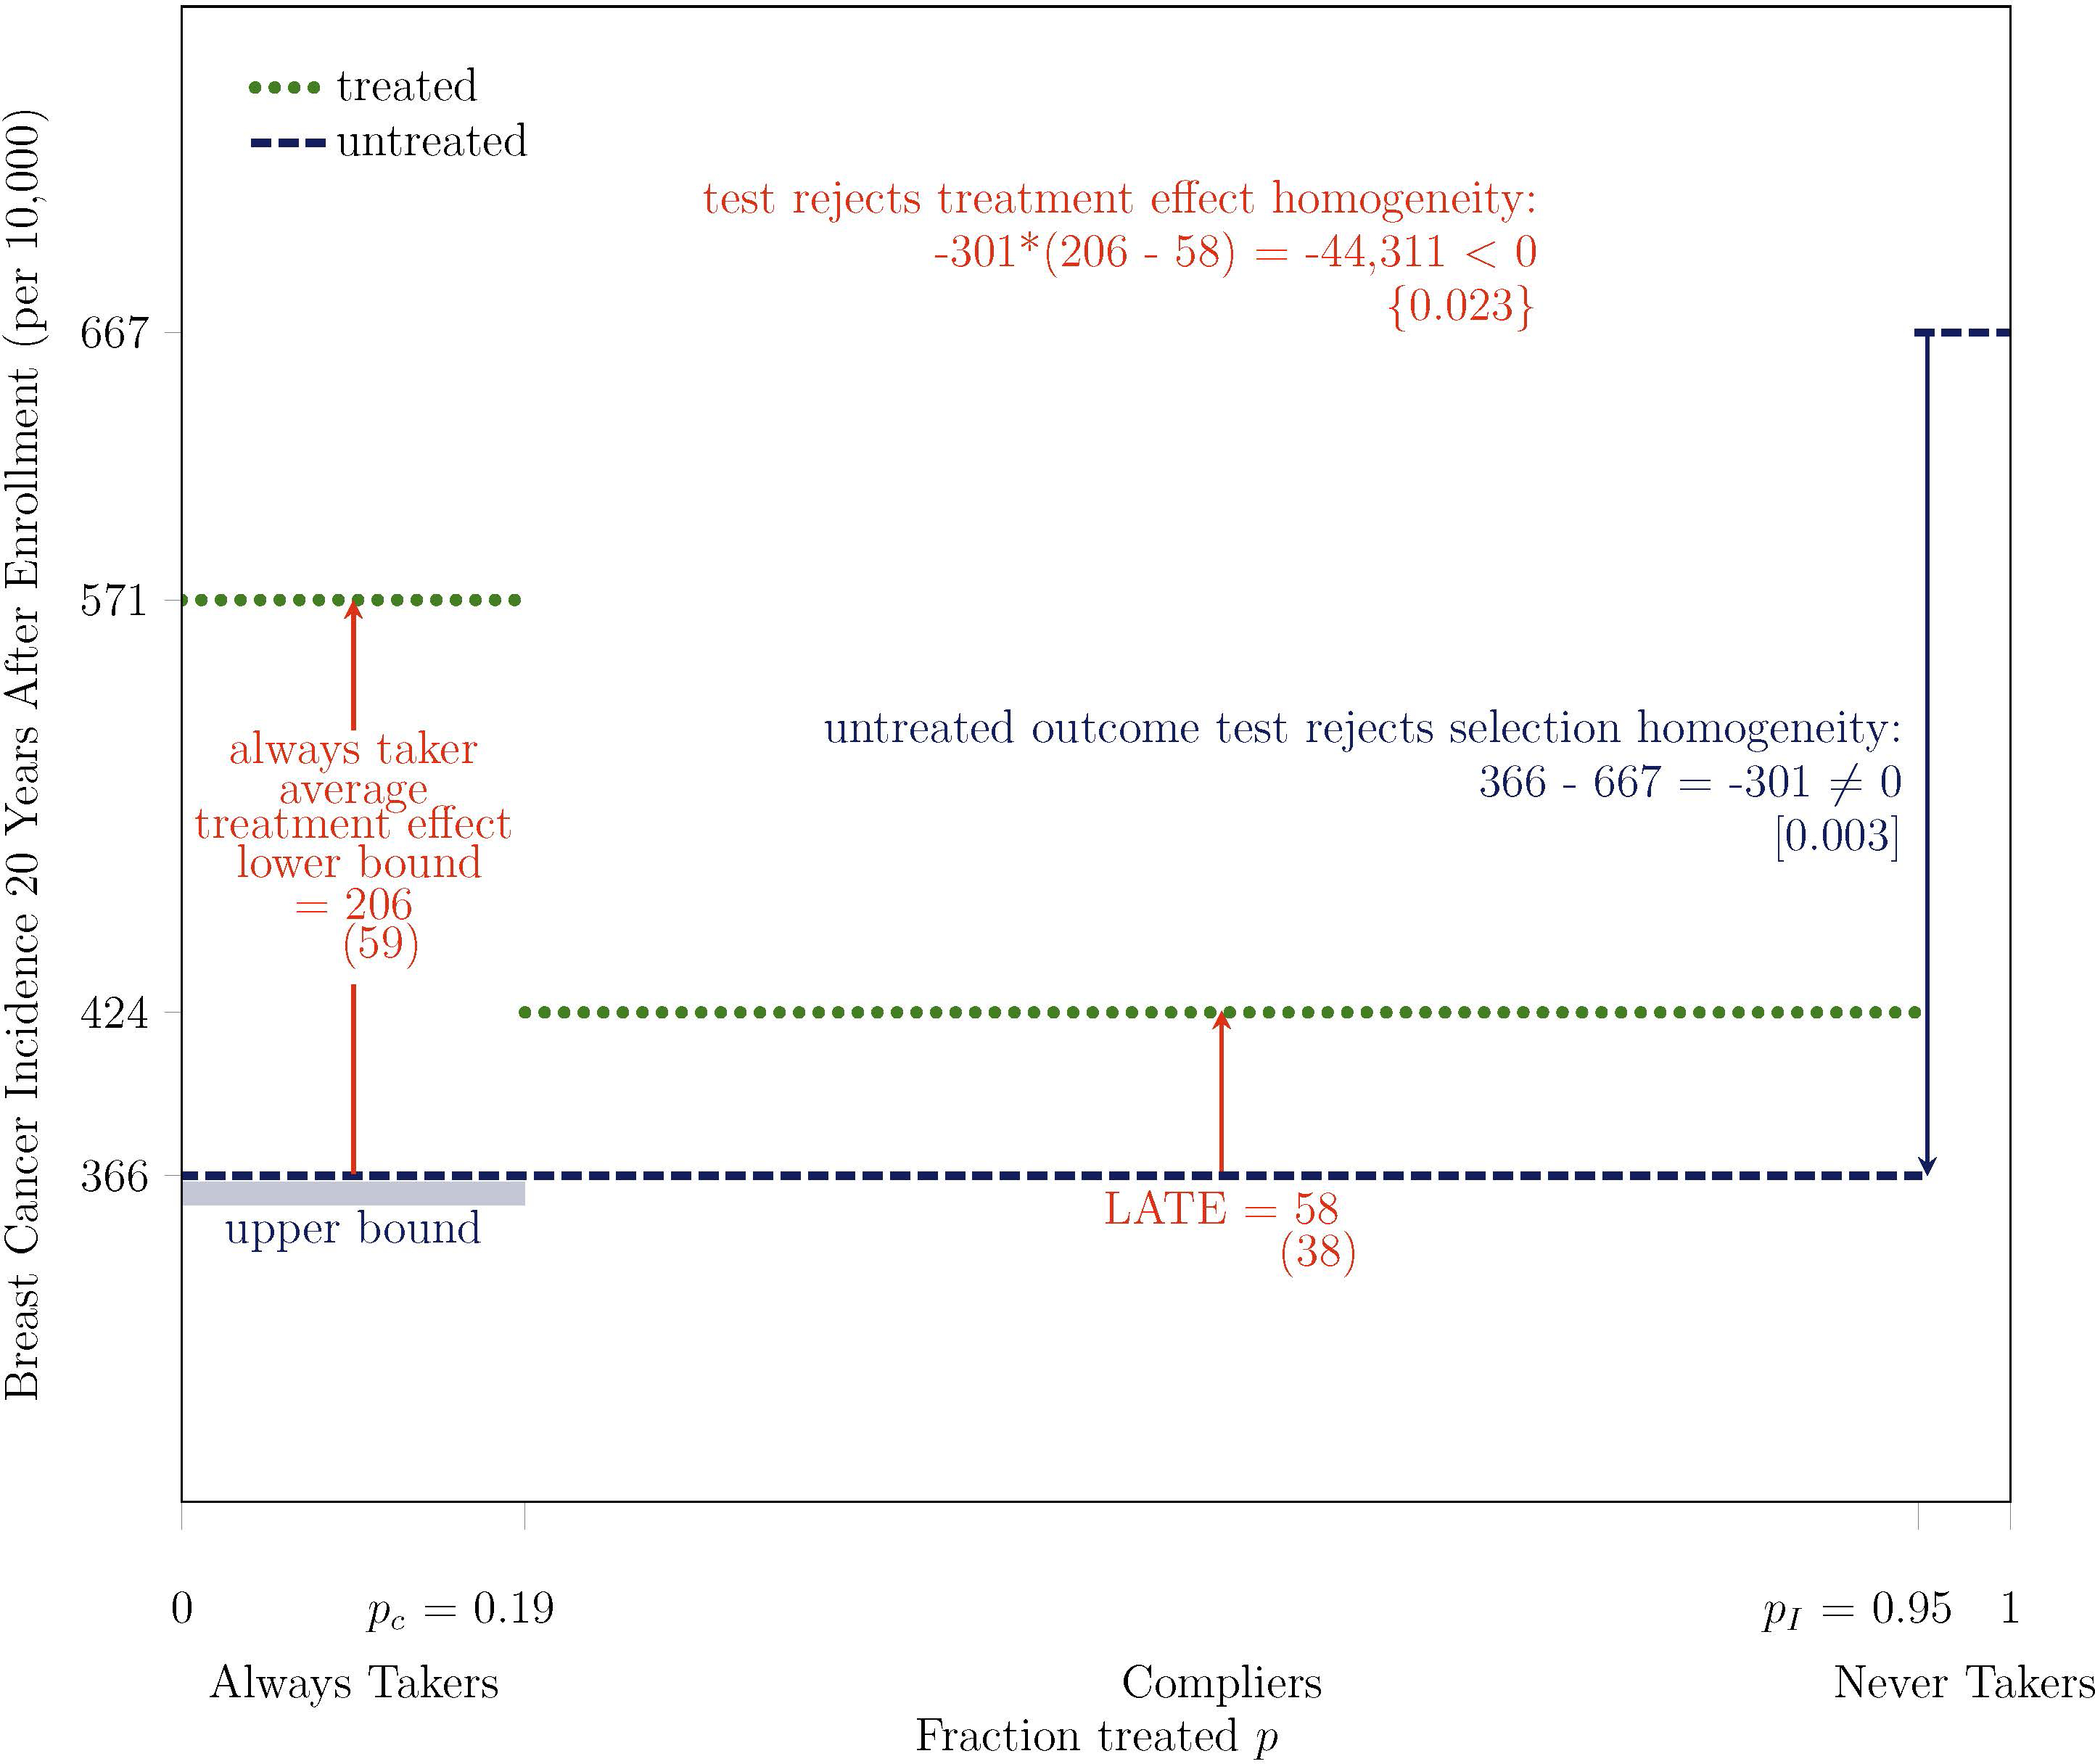
Test Rejects Treatment Effect Homogeneity on Breast Cancer Incidence at 2.3% Level: Overdiagnosis is at Least 3.5 Times Higher Among Women Most Likely to Receive Mammograms, At Least 36% (= 206/571) of Their Cancers are Overdiagnosed
Note. Bootstrapped standard errors are under point estimates in parentheses, two-tailed bootstrapped p-values are under test statistics in brackets, and one-tailed bootstrapped p-values are under test statistics in curly braces. The outcome Y is breast cancer incidence, measured 20 years after enrollment for all participants, based on initial diagnosis and the exact calendar date of enrollment. The treatment D is mammography, which is equal to one if a participant receives a mammogram in at least one year during the active study period after the enrollment year. The instrument Z is equal to one if a participant is assigned to intervention. pC is the fraction treated in control P(D = 1 | Z = 0) and pI is the fraction treated in intervention P(D = 1 | Z = 1). The main analysis sample includes women aged 40–49 at enrollment and excludes those who report any breast cancer in their family, any previous breast cancer diagnosis, any other breast disease, or any symptoms, as well as those for whom a nurse found abnormalities or referred them for review. Some differences between statistics might not appear internally consistent because of rounding.