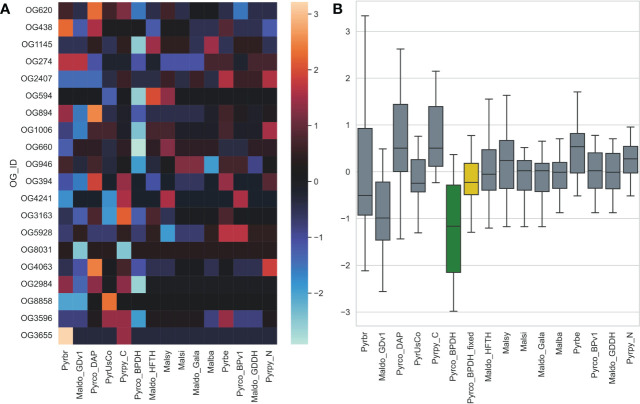
Figure 10.
The gene count z-score of selected tree architecture gene families across Pyrus and Malus genomes. Pyrco_BPDH orthogroups have lower z-scores than most others, which is shown with a cooler color in the heatmap (A) and lower average z-score (green box in B), indicating fewer than expected gene counts. These missing genes were discovered after the targeted re-annotation process, which brought the average gene count z-score closer to 0 (yellow box in B) and comparable to other high-quality genomes. Genome abbreviations can be found in Supplemental Table 7 .

