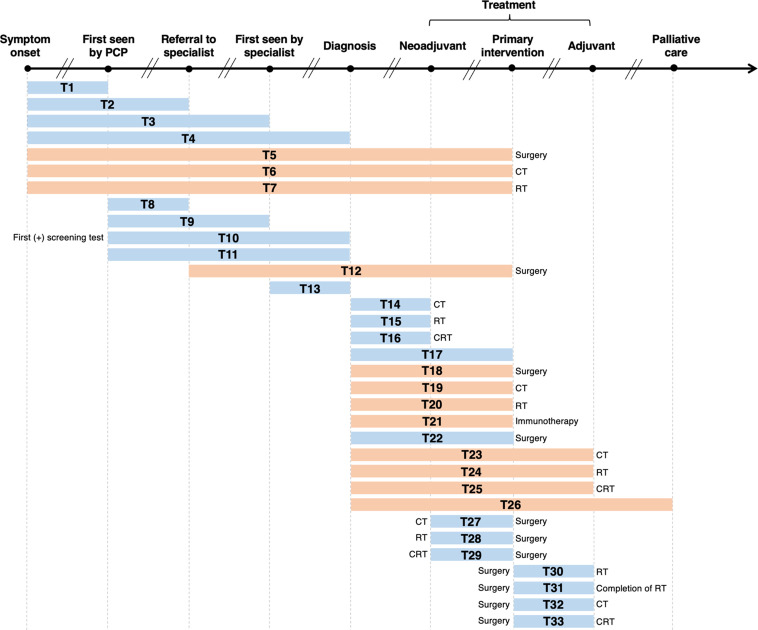
Figure 2. Visualization of lag time intervals identified in systematic reviews and/or meta-analyses on the association between time to cancer diagnosis and/or treatment and clinical outcomes.
Top arrow represents the cancer care continuum along broad milestones (data points in bold). Oblique breaks denote the incongruency of lag times between milestones (i.e., inconsistent periods of time between milestones; not every cancer patient undergoes all milestones or undergo each milestone sequentially). Each bar indicates a lag time interval (T1–T33). Start and endpoints of each lag time interval are defined by the corresponding milestones. Text before or after a bar defines specific start or endpoints of a lag time interval whenever explicitly reported in a systematic review and/or meta-analysis. Orange shading of bars denotes lag time intervals that do not necessarily include all the milestones through which the bars physically pass (e.g., T18 starts at diagnosis and ends at surgery, without necessarily including neoadjuvant therapy). Blue shading of bars denotes lag time intervals that do include all milestones through which the bars physically pass (e.g., T22 starts at diagnosis and ends at surgery, including neoadjuvant therapy). ART, adjuvant radiotherapy; CRT, chemoradiotherapy; CT, chemotherapy; PCP, primary care provider; RT, radiotherapy.

