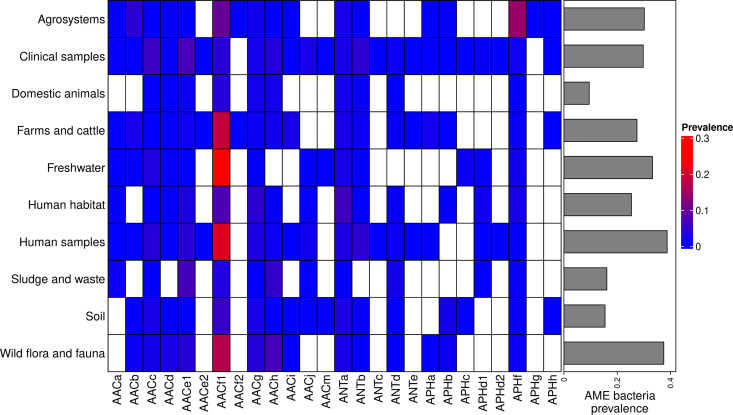
Figure 3. Prevalence of AME-gene-carrying bacteria across land biomes.
In the heatmap, blank boxes correspond to the observed absence of a CHG. For the other colors, blue to red boxes stand for CHG frequencies from near-zero to 0.3. Gray bars on the right correspond to the prevalence of AME bacteria for each biome, i.e. the prevalence of genomes in which at least one AME gene was found. APHe is excluded from the heatmap because it was sampled in seawater only.

