. 2023 Feb 14;12:e77015. doi: 10.7554/eLife.77015

Figure 4. Global time trends for aminoglycoside resistance.

(A) First sampling occurrence for each CHG in the analyzed dataset. First sampling occurrence of APHe is unknown. (B) Evolution of the worldwide and European prevalences of AME bacteria between 1943 and 2019. The dots and error bars represent the measured prevalence (± standard error) of AME bacteria each year. The dotted line represents a binomial regression of the prevalence of AME bacteria over time, fitted separately before 1995 and after 1995. The blue curve represents the number of bacteria genomes sampled each year (in logarithmic scale). Orange stars represent the dates at which the following aminoglycoside drugs were released for commercial use: streptomycin, neomycin, hygromycin, kanamycin, paromomycin, capreomycin, gentamicin, ribostamycin, dibekacin, tobramycin, amikacin, sisomicin, netilmicin, micronomicin, isepamycin, plazomicin. The red rectangle displays the period of time analyzed in panel: (C) Evolution of worldwide CHG frequencies among sampled AME genes between 1990 and 2019. 17 CHGs for which less than 400 sequences were sampled are grouped and displayed in gray.

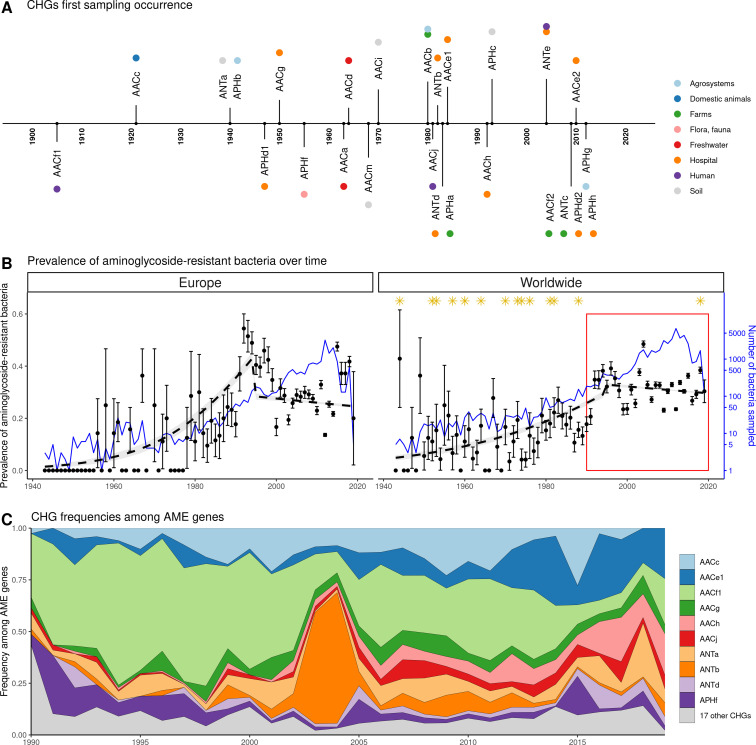
Figure 4.

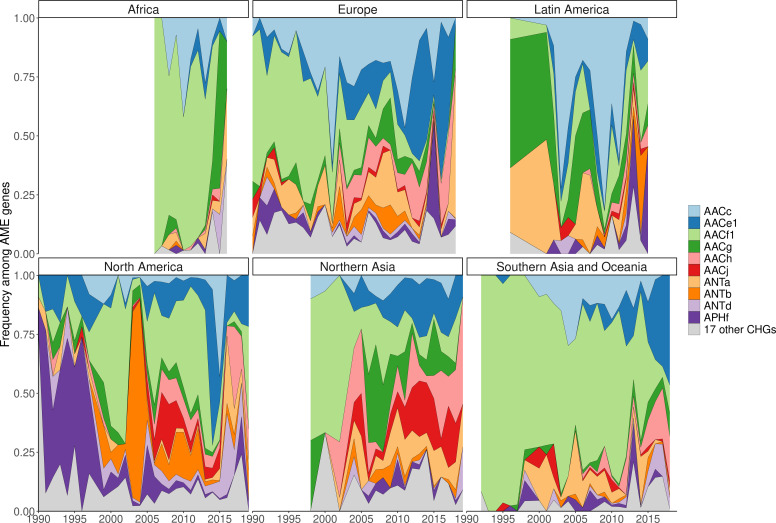
Figure 4—figure supplement 1. Evolution of continental CHG frequencies among sampled AME genes between 1990 and 2019.

Figure 4—figure supplement 1.

IMAGE24 regions were gathered to higher continental ensembles in order to obtain more representative frequencies. Western and Central Europe and ‘Ukraine’ were gathered to Europe; Canada and the USA to North America; the rest of the Americas to Latin America; all African landmasses to Africa; Oceania, Southeastern Asia, ‘Indonesia’, and ‘India’ to Southern Asia and Oceania; Korea, Japan, Middle East, Turkey, ‘China’, ‘Asia-Stan’, and ‘Russia’ to Northern Asia. CHG frequencies were only computed when at least 10 AME-gene-carrying bacteria had been sampled in a continent in a year.
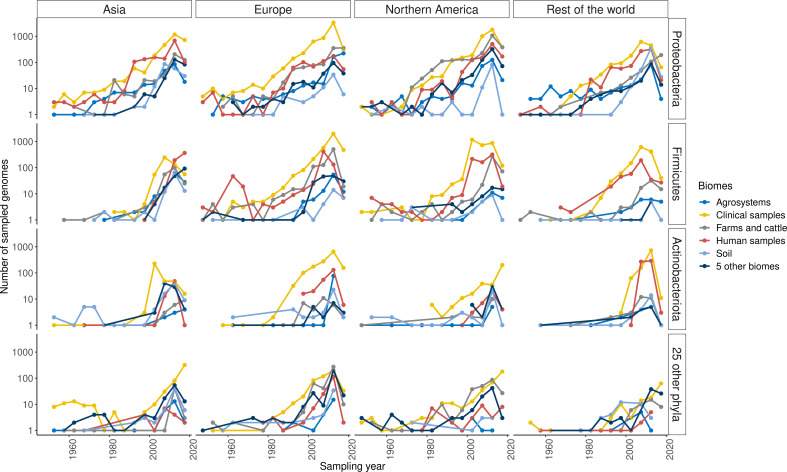
Figure 4—figure supplement 2. Distribution of sampling over time, space, ecology, and phylogeny.

Figure 4—figure supplement 2.

Each point represents a 5-year period between 1945 and 2019. Rows display different phyla, columns different continents, and colors different biomes. IMAGE24 regions were gathered to higher geographical entities for simplification. Only the biomes, phyla, and geographical regions with the most sampled genomes are displayed, the others being gathered to single categories.