. 2023 Feb 14;12:e64978. doi: 10.7554/eLife.64978

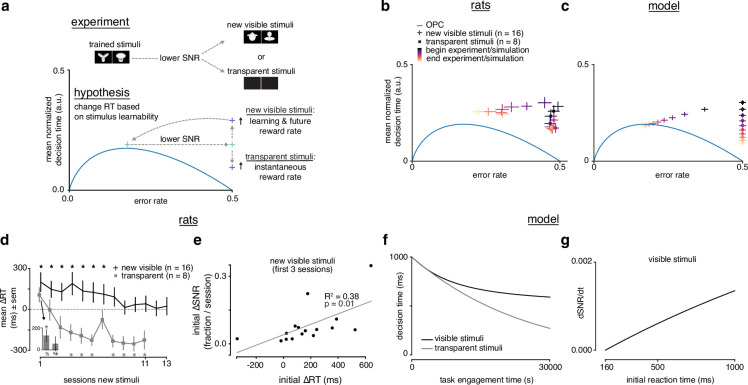
Figure 6. Rats choose reaction time based on stimulus learnability.

(a) Schematic of experiment: rats trained on stimulus pair 1 were presented with new visible stimulus pair 2 or transparent (alpha = 0, 0.1) stimuli. If rats change their reaction times based on stimulus learnability, they should increase their reaction times for the new visible stimuli to increase learning and future iRR and decrease their reaction time to increase iRR for the transparent stimuli. (b) Learning across normalized sessions in speed-accuracy space for new visible stimuli (n=16, crosses) and transparent stimuli (n=8, squares). Color map indicates time relative to start and end of the experiment. (c) iRR-sensitive threshold model runs with ‘visible’ (crosses) and ‘transparent’ (squares) stimuli (modeled as containing some signal, and no signal) plotted in speed-accuracy space. The crosses are illustrative and do not reflect any uncertainty. Color map indicates time relative to start and end of simulation. (d) Mean change in reaction time across sessions for visible stimuli or transparent stimuli compared to previously known stimuli. Positive change means an increase relative to previous average. Inset: first and second half of first session for transparent stimuli. * denotes p<0.05 in permutation test. (e) Correlation between initial individual mean change in reaction time (quantity in d) and change in signal-to-noise ratio (SNR) (learning speed: slope of linear fit to SNR per session) for first three sessions with new visible stimuli. R2 and p from linear regression in d. Error bars reflect standard error of the mean in b and d. (f) Decision time across time engagement time for visible and transparent stimuli runs in model simulation. (g) Instantaneous change in SNR (ddtA¯) as a function of initial reaction time (decision time + non-decision time T0) in model simulation.

Figure 6.

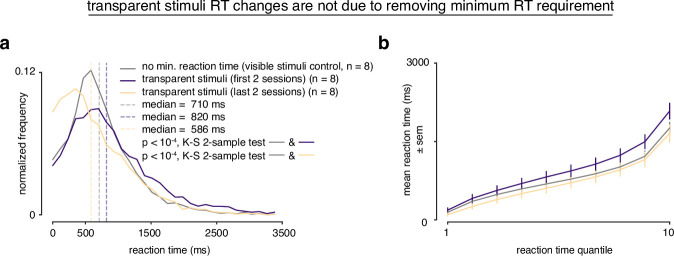
Figure 6—figure supplement 1. Reaction time analysis of transparent stimuli experiment.

Figure 6—figure supplement 1.

(a) During transparent stimuli, the reaction time (RT) minimum was relaxed to 0 ms to fully measure a possible shift in RT behavior. To be able to ascertain whether transparent stimuli led to a significant change in RT, the RT histogram of transparent stimuli (early [first two sessions]: purple, late [last two sessions]: yellow) sessions was compared to control sessions with visible stimuli (gray) with no RT minimum. Medians indicated with dashed lines. Kolmogorv-Smirnov two-sample tests over distributions found significant differences (p<104). (b) Vincentized RTs for transparent and control visible stimuli sessions with no minimum reaction time showed the early transparent sessions were slower than the control sessions, and the late sessions were faster across quantiles.
Figure 6—figure supplement 2. Vincentized reaction time distributions throughout learning.

Figure 6—figure supplement 2.

(a) Vincentized reaction time distributions for n=26 subjects learning stimulus pair 1 (first 3 sessions, purple; last 10 asymptotic sessions, yellow). (b) Vincentized reaction time distributions for n=16 subjects learning stimulus pair 2 (first 2 sessions, purple; last 2 sessions, yellow). (b) Vincentized reaction time distributions for n=8 subjects learning transparent stimuli (first 2 sessions, purple; last 2 sessions, yellow).
Figure 6—figure supplement 3. Simple drift-diffusion model (DDM) + variable drift rate variability fits for transparent stimuli.
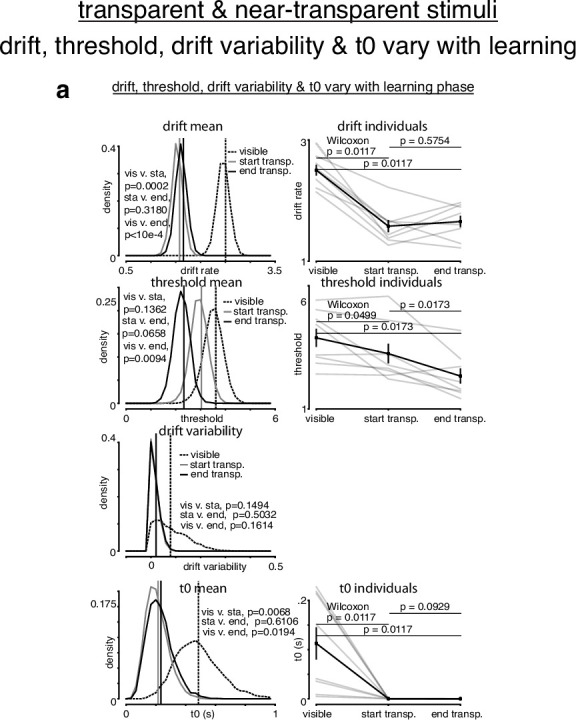
Figure 6—figure supplement 3.

(a) The learning data from transparent stimuli were fit with a simple DDM + variable drift rate variability using the hierarchical DDM (HDDM) framework (Wiecki et al., 2013). Three learning phases were included: the last 500 trials with control visible stimuli, and the first 500 and the last trials with transparent stimuli. (a) We allowed drift rate, threshold, drift rate variability, and T0 to vary with learning phase. Drift rate decreased with transparent stimuli, remaining constant throughout. Threshold monotonically decreased with transparent stimuli. Drift rate variability appeared to decrease and stay constant with transparent stimuli, albeit at a value near 0. T0 appeared to decrease with transparent stimuli. p-Values were calculated as in Figure 4—figure supplement 2.
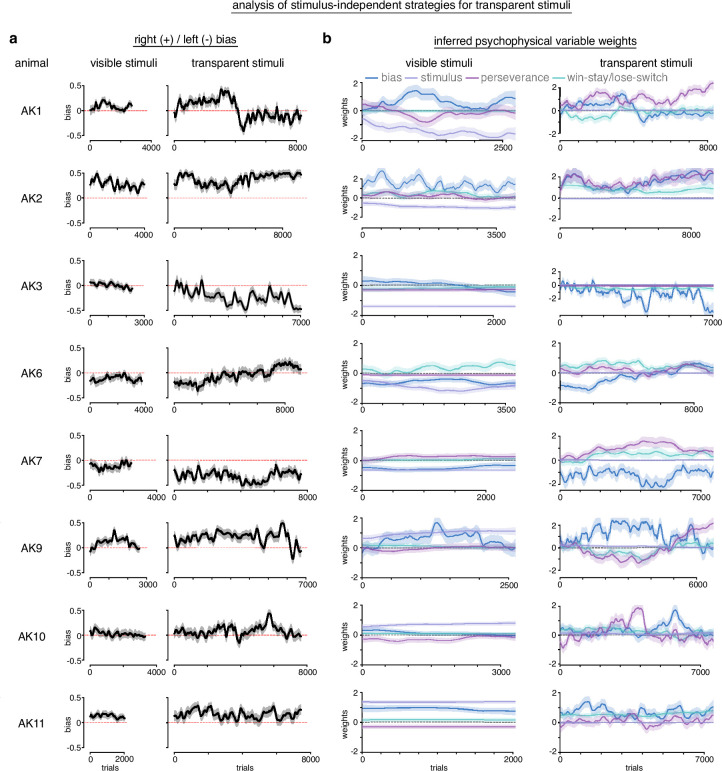
Figure 6—figure supplement 4. Analysis of stimulus-independent strategies for transparent stimuli.

Figure 6—figure supplement 4.

In order to measure the extent of stimulus-independent strategies for transparent stimuli, we fit baseline sessions with visible stimuli and sessions with the transparent stimuli with PsyTrack, a flexible generalized linear model (GLM) package for measuring the weights of different inferred psychophysical variables (Roy et al., 2021). We fit our data with a model that included bias, win-stay/lose-switch (previous trial outcome), perseverance (previous trial choice), and the actual stimulus as potential explanatory variables for left/right choice behavior. (a) Measurement of bias across n=8 animals. Generally, bias and bias variability increased with transparent stimuli compared to visible stimuli. Although not uniform, animals tended to become more biased to the side that they were already biased during visible stimuli. (b) During visible stimuli, the stimulus had strong non-zero weights, indicating it influenced choice behavior. Stimulus has positive weights for some animals and negative for others because stimuli mappings were counterbalanced across animals. Win-stay/lose-switch and perseverance weights varied across animals during visible stimuli. Generally, these variables increased weights and variability during transparent stimuli, while the stimulus collapsed to a weight of 0 (as expected, given it was transparent). The weight of the bias variable was omitted for visual clarity as the actual bias was reported in a.
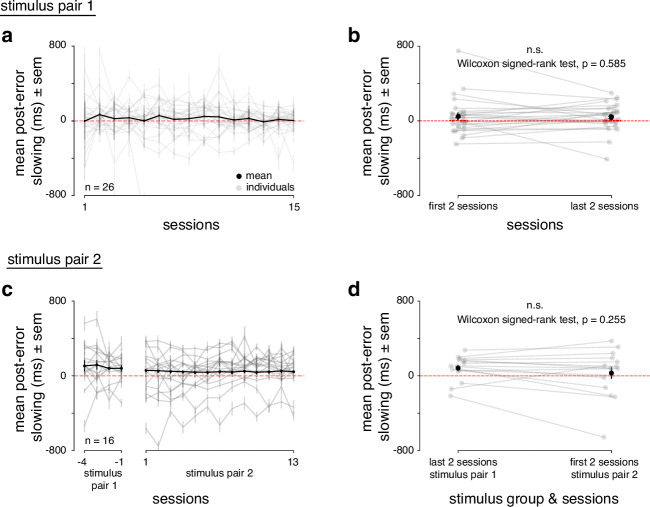
Figure 6—figure supplement 5. Post-error slowing during rat learning dynamics.

Figure 6—figure supplement 5.

(a) Individual (gray) and mean (black) post-error slowing across first 15 sessions for n=26 animals. Post-error slowing was calculated by taking the difference between RTs on trials with previous correct trials and previous error trials. A positive difference indicates post-error slowing. (b) Individual mean (gray) and population mean (black) post-error slowing for first 2 sessions of learning and last 2 sessions of learning for n=26 animals. A Wilcoxon signed-rank test found no significant difference in post-error slowing between the first 2 and last 2 sessions for every animal (p = 0.585). (c) Same as in a for n=16 rats, with the addition of 4 baseline sessions with stimulus pair 1 plus the 13 sessions while subjects were learning stimulus pair 2. (d) Same as in b but comparing the last 2 baseline sessions with stimulus pair 1 and the first 2 sessions learning stimulus pair 2. A Wilcoxon signed-rank test found no significant difference in post-error slowing when the animals started learning stimulus pair 2 (p = 0.255).