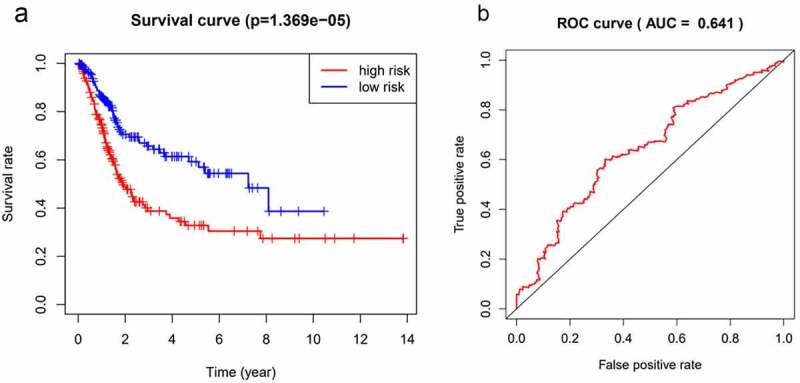
Figure 1.

The risk survival curve of the model based on the 4 ECM differentially expressed genes was closely related to the overall survival rate, and the survival rate of the high-risk group was worse than that of the low-risk group (p = 1.369e-05)(a). The ROC curve was established based on the model constructed by the 4 ECM differentially expressed genes, and the area under the curve (AUC) was 0.641(b).
