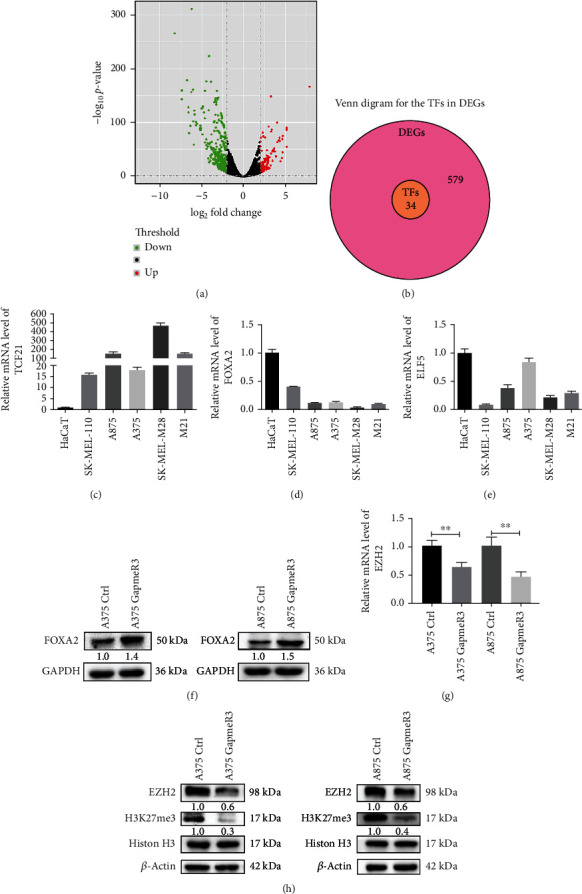
Figure 4.

SAMMSON inhibits FOXA2 protein expression in melanoma cells. (a) Volcano plot of differentially expressed genes in patients with high and low SAMMSON expression. Red, green, and black indicate upregulated, downregulated, and unaffected genes, respectively. (b) Venn diagram for the TFs in DEGs. (c–e) RT-qPCR analysis of the relative mRNA expression of TCF21, FOXA2, and ELF5 in HaCaT and melanoma cell lines. (f) Western blotting analysis of the protein expression of FOXA2 in SAMMSON-silenced and control melanoma cells. (g) RT-qPCR analysis of the relative mRNA expression of EZH2 in SAMMSON-silenced and control melanoma cells. (h) Western blotting analysis of the protein expression of EZH2 and H3K27me3 in SAMMSON-silenced and control melanoma cells. ∗∗p < 0.01 vs. control cells.
