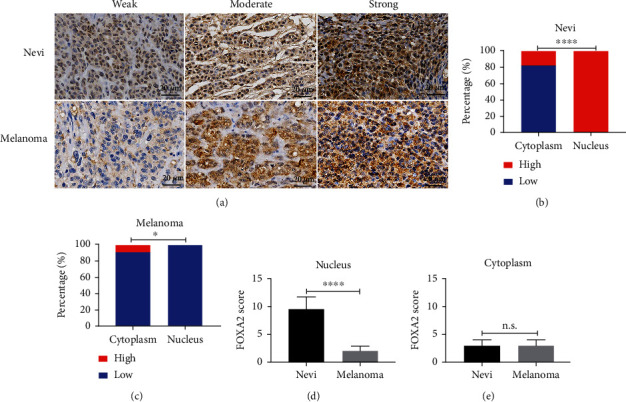
Figure 5.

Immunohistochemical staining of FOXA2 in nevi and melanoma tissues. (a) Representative images of IHC staining for FOXA2 in nevi (n = 11) and melanoma (n = 67). FOXA2 staining was stronger in nevi cells and was located mainly in the nucleus. Staining was weaker in melanoma tissues and was located primarily in the cytoplasm. (b, c) Percentage of nevi and melanoma tissues with high or low FOXA2 expression in the cytoplasm and nucleus. (d, e) IRSs of FOXA2 staining in nevi and melanoma tissues. Scale bars = 20 μm. ∗p < 0.05, ∗∗∗∗p < 0.0001.
